


Discover 7 essential code complexity metrics to enhance software quality, streamline maintenance, and improve team collaboration.
Want better code? Track these 7 key complexity metrics:
- Cyclomatic Complexity
- Halstead Complexity Measures
- Maintainability Index
- Lines of Code (LOC)
- Cognitive Complexity
- Depth of Inheritance
- Coupling Between Objects
Why bother? These metrics help you:
- Catch potential bugs early
- Make code easier to understand and maintain
- Save time and money long-term
Here's a quick comparison:
| Metric | Measures | Why It Matters |
|---|---|---|
| Cyclomatic Complexity | Code paths | Higher = harder to test |
| LOC | Code size | Bigger isn't always better |
| Maintainability Index | Ease of maintenance | Higher = easier to work with |
| Cognitive Complexity | Mental effort to understand | Lower = more readable |
Ready to start? Tools like SonarQube, Checkmarx, and PMD can help. Pick 2-3 metrics to focus on, set up automated tracking, and review weekly.
Remember: These are guides, not rules. Use them to improve, not obsess over perfect scores.
Related video from YouTube
Benefits of Tracking Code Complexity
Tracking complexity offers key advantages:
Improved Software Quality
Teams can:
- Spot potential bug hotspots
- Cut error risk
- Boost code readability
Netflix engineers used complexity metrics to tackle issues with their Chaos Monkey tool. They cut average Cyclomatic Complexity by 25%, improving maintainability.
Cost-Effective Maintenance
Complex code often means:
- Longer debugging
- Tough updates
- Hard onboarding
Tracking helps teams:
- Find refactoring targets
- Streamline maintenance
- Cut long-term costs
Better Resource Allocation
Complexity metrics guide teams in:
- Prioritizing refactoring
- Allocating testing resources
- Planning code reviews
GitHub used static analysis to find complexity hotspots in their search function. This led to faster searches and easier maintenance.
Enhanced Team Collaboration
Complexity metrics provide:
- A shared language for code quality
- Objective measures for reviews
- Clear improvement goals
Proactive Risk Management
Teams can:
- Prevent technical debt buildup
- Catch security issues early
- Address scalability problems
A study of 12,000+ projects found quality issues caused over 20% of failures. Tracking complexity helps avoid these pitfalls.
Quantifiable Quality Standards
Teams can:
- Set clear benchmarks
- Measure progress
- Compare solutions objectively
HTEC reports their code's cyclomatic complexity is up to 8x lower than industry averages, and cognitive complexity up to 11x lower.
7 Key Code Complexity Metrics
Here are seven key metrics to watch:
1. Cyclomatic Complexity
Measures independent code paths. Calculated as:
M = E - N + P
Where:
- M = Cyclomatic Complexity
- E = Edges
- N = Nodes
- P = Connected components
Simple functions score 1, complex ones 4+. High scores often mean hard-to-test code.
2. Halstead Complexity Measures
Analyzes code structure and vocabulary. Halstead Volume:
V = N * log2(n)
Where:
- V = Halstead Volume
- N = Program length
- n = Program vocabulary
Helps gauge cognitive effort needed to understand code.
3. Maintainability Index
Combines metrics to assess maintainability:
| Component | Weight |
|---|---|
| Halstead Volume | 50% |
| Cyclomatic Complexity | 25% |
| Lines of Code | 25% |
| Comments (optional) | Can improve score |
Higher score = more maintainable code.
4. Lines of Code (LOC)
Counts executable code lines. Simple but gives basic size and complexity measure.
5. Cognitive Complexity
Assesses readability by considering:
- Nested control structures
- Logical operators
- Variable naming
- Code formatting
Quantifies mental effort to understand code.
6. Depth of Inheritance
Measures class hierarchy levels. Deep inheritance can complicate understanding and maintenance.
| Depth | Complexity |
|---|---|
| 0-2 | Low |
| 3-4 | Moderate |
| 5+ | High |
7. Coupling Between Objects
Measures component interdependence. High coupling can make changes harder.
Types include:
- Data coupling
- Control coupling
- External coupling
Lower coupling usually means more modular, maintainable code.
Adding Complexity Tracking to Your Work
To track complexity:
- Choose a tool
Popular options:
| Tool | Features |
|---|---|
| SonarQube | Continuous quality inspection |
| CodeClimate | Automated review and analysis |
| ESLint | JavaScript linting and style checks |
- Integrate with CI/CD
Example GitLab CI/CD config:
code_quality:
  stage: test
  image: docker:stable
  variables:
    DOCKER_DRIVER: overlay2
  allow_failure: true
  services:
    - docker:stable-dind
  script:
    - export SP_VERSION=$(echo "$CI_SERVER_VERSION" | sed 's/^\([0-9]*\)\.\([0-9]*\).*/\1-\2-stable/')
    - docker run
        --env SOURCE_CODE="$PWD"
        --volume "$PWD":/code
        --volume /var/run/docker.sock:/var/run/docker.sock
        "registry.gitlab.com/gitlab-org/security-products/codequality:$SP_VERSION" /code
  artifacts:
    reports:
      codequality: gl-code-quality-report.json
- Set team standards
Example thresholds:
| Metric | Threshold |
|---|---|
| Cyclomatic Complexity | < 10 |
| Maintainability Index | > 65 |
| Depth of Inheritance | < 5 |
- Configure auto-checks
SonarQube quality gate example:
if (complexity > 10) {
  raise_issue("Cyclomatic complexity exceeds threshold")
}
- Review and refactor
Regularly address flagged issues. Allocate sprint time for complexity concerns.
sbb-itb-bfaad5b
Understanding and Using Complexity Metrics
To use metrics effectively:
Interpreting Reports
Focus on:
| Metric | Ideal Range | Action if Exceeded |
|---|---|---|
| Cyclomatic Complexity | < 10 | Break down complex functions |
| LOC | < 100 per function | Modularize large functions |
| Depth of Inheritance | < 5 | Simplify class hierarchies |
| Coupling Between Objects | < 5 | Reduce class dependencies |
Making Data-Driven Decisions
Use complexity data to:
- Prioritize refactoring
- Allocate resources
- Set coding standards
Reducing Complexity
To lower scores:
- Simplify logic
- Extract methods
- Use design patterns
Real-World Example
Spotify's team used metrics to improve their recommendation algorithm. By breaking down complex functions and applying the Strategy pattern, they cut average cyclomatic complexity from 15 to 8. This led to 30% fewer bugs and 20% faster feature development.
Avoiding Pitfalls
- Don't obsess over perfect scores
- Consider context
- Balance multiple metrics
Mistakes to Avoid with Complexity Metrics
Watch out for these common traps:
Overreliance on Single Metrics
Combine multiple metrics for a full picture. Consider cyclomatic complexity alongside test coverage and production issues.
Ignoring Context
Not all complex code is bad. Some algorithms need higher complexity for performance. Evaluate complex methods individually.
Sacrificing Functionality for Simplicity
Balance is key:
| Approach | Benefit | Risk |
|---|---|---|
| Refactoring | Improves maintainability | May introduce bugs |
| Decoupling | Enhances modularity | Can obscure design if overdone |
| Minimalism | Simplifies codebase | Might limit features |
Misinterpreting Metrics
Treat metrics as indicators, not absolutes. Use judgment when addressing code smells.
Neglecting Readability
Prioritize clean, readable code over overly optimized code.
Blindly Applying Principles
Evaluate design principles like SOLID in your specific context. Avoid over-engineering that increases complexity.
Tools for Measuring Code Complexity
Popular options include:
SonarQube
- Supports 25+ languages
- Open-source with free and paid versions
- Integrates with IDEs and CI/CD pipelines
A Fortune 500 developer reported: "SonarQube helped us cut technical debt by 30% in 6 months."
Checkmarx SAST

Enterprise-grade tool for early security vulnerability detection.
Snyk Code
Free static analysis for small teams and individuals.
PMD
Free, open-source tool supporting multiple languages.
Microsoft Application Inspector
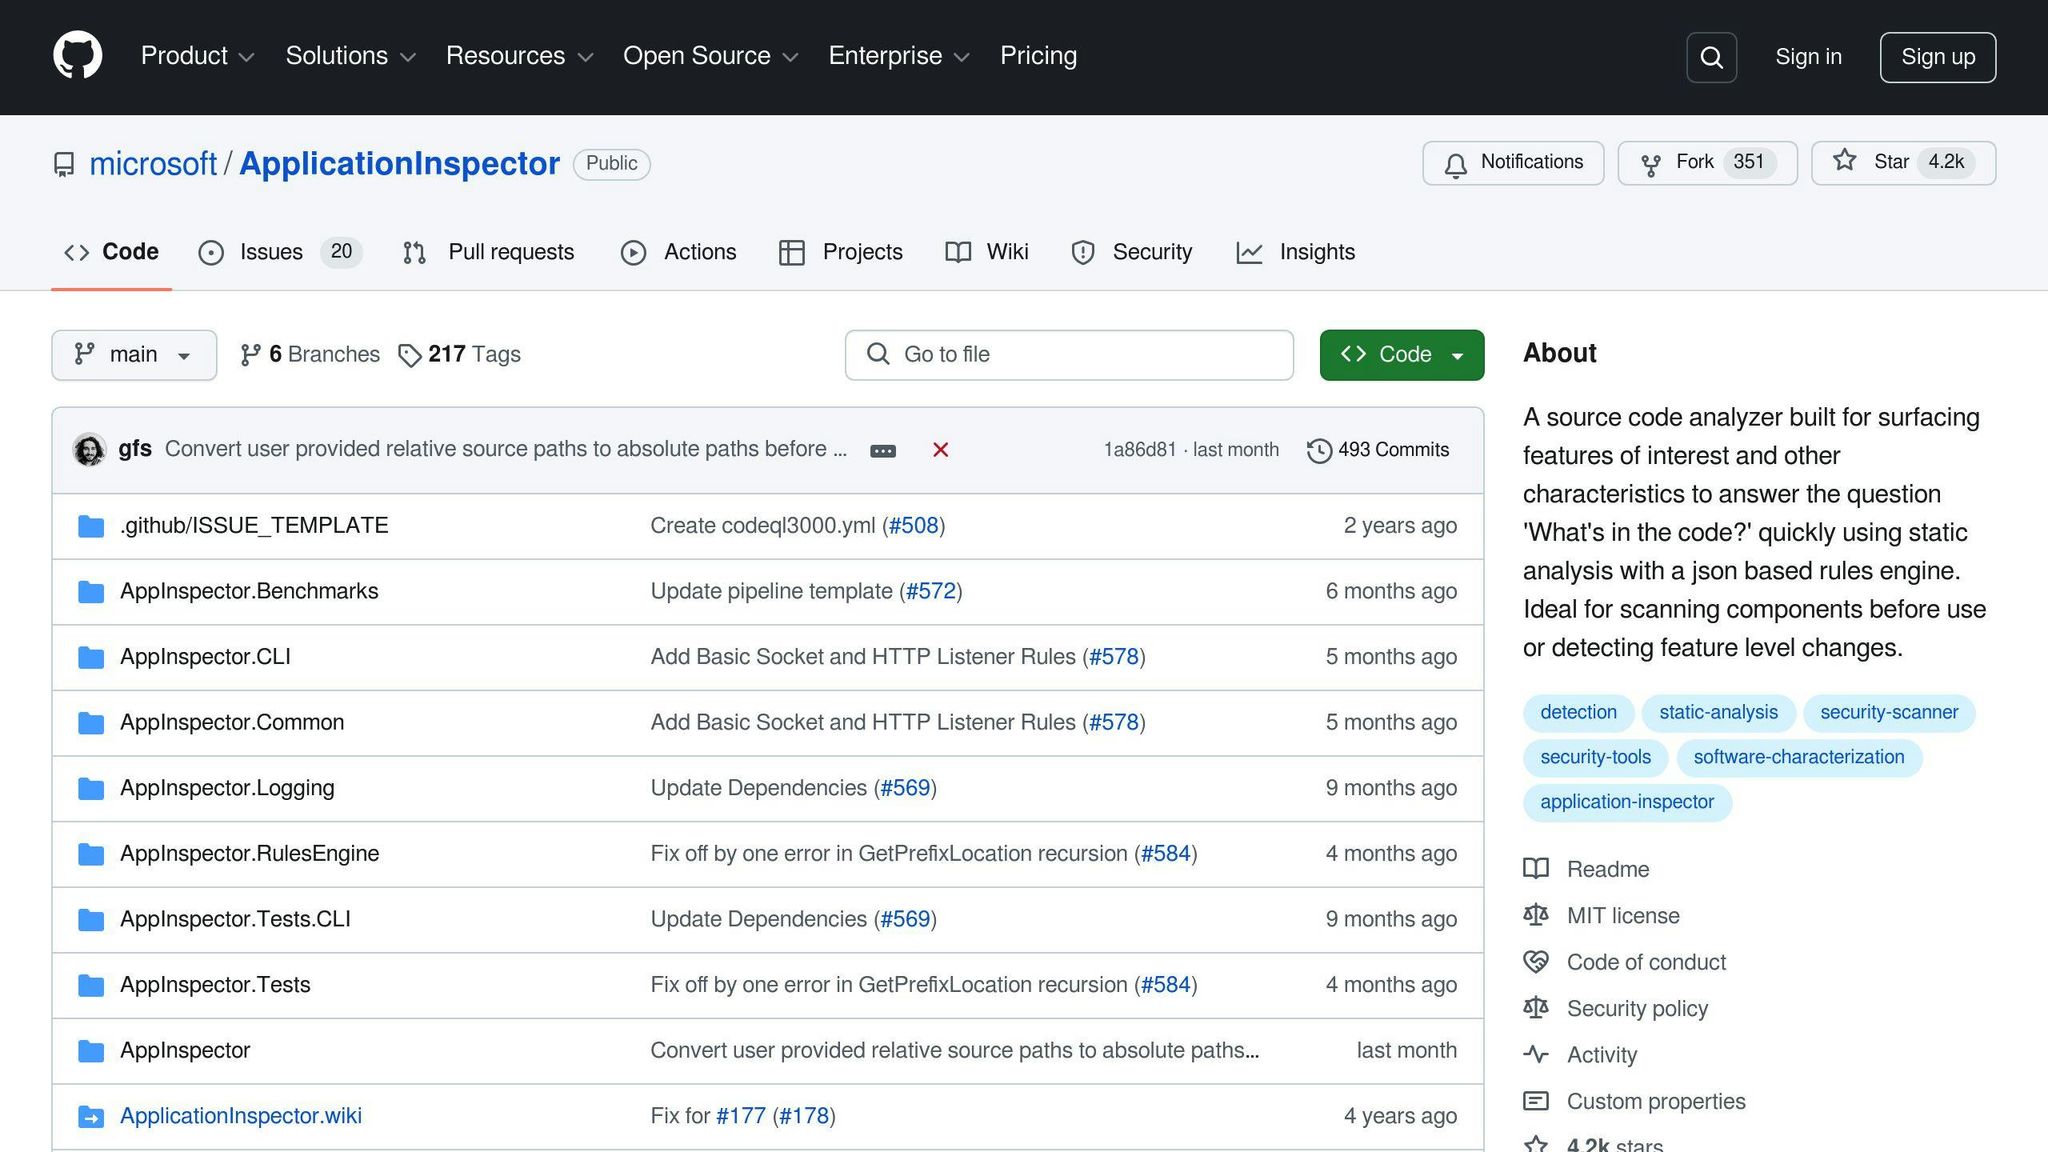
Basic tool using RegEx patterns for rule checking.
DeepSource
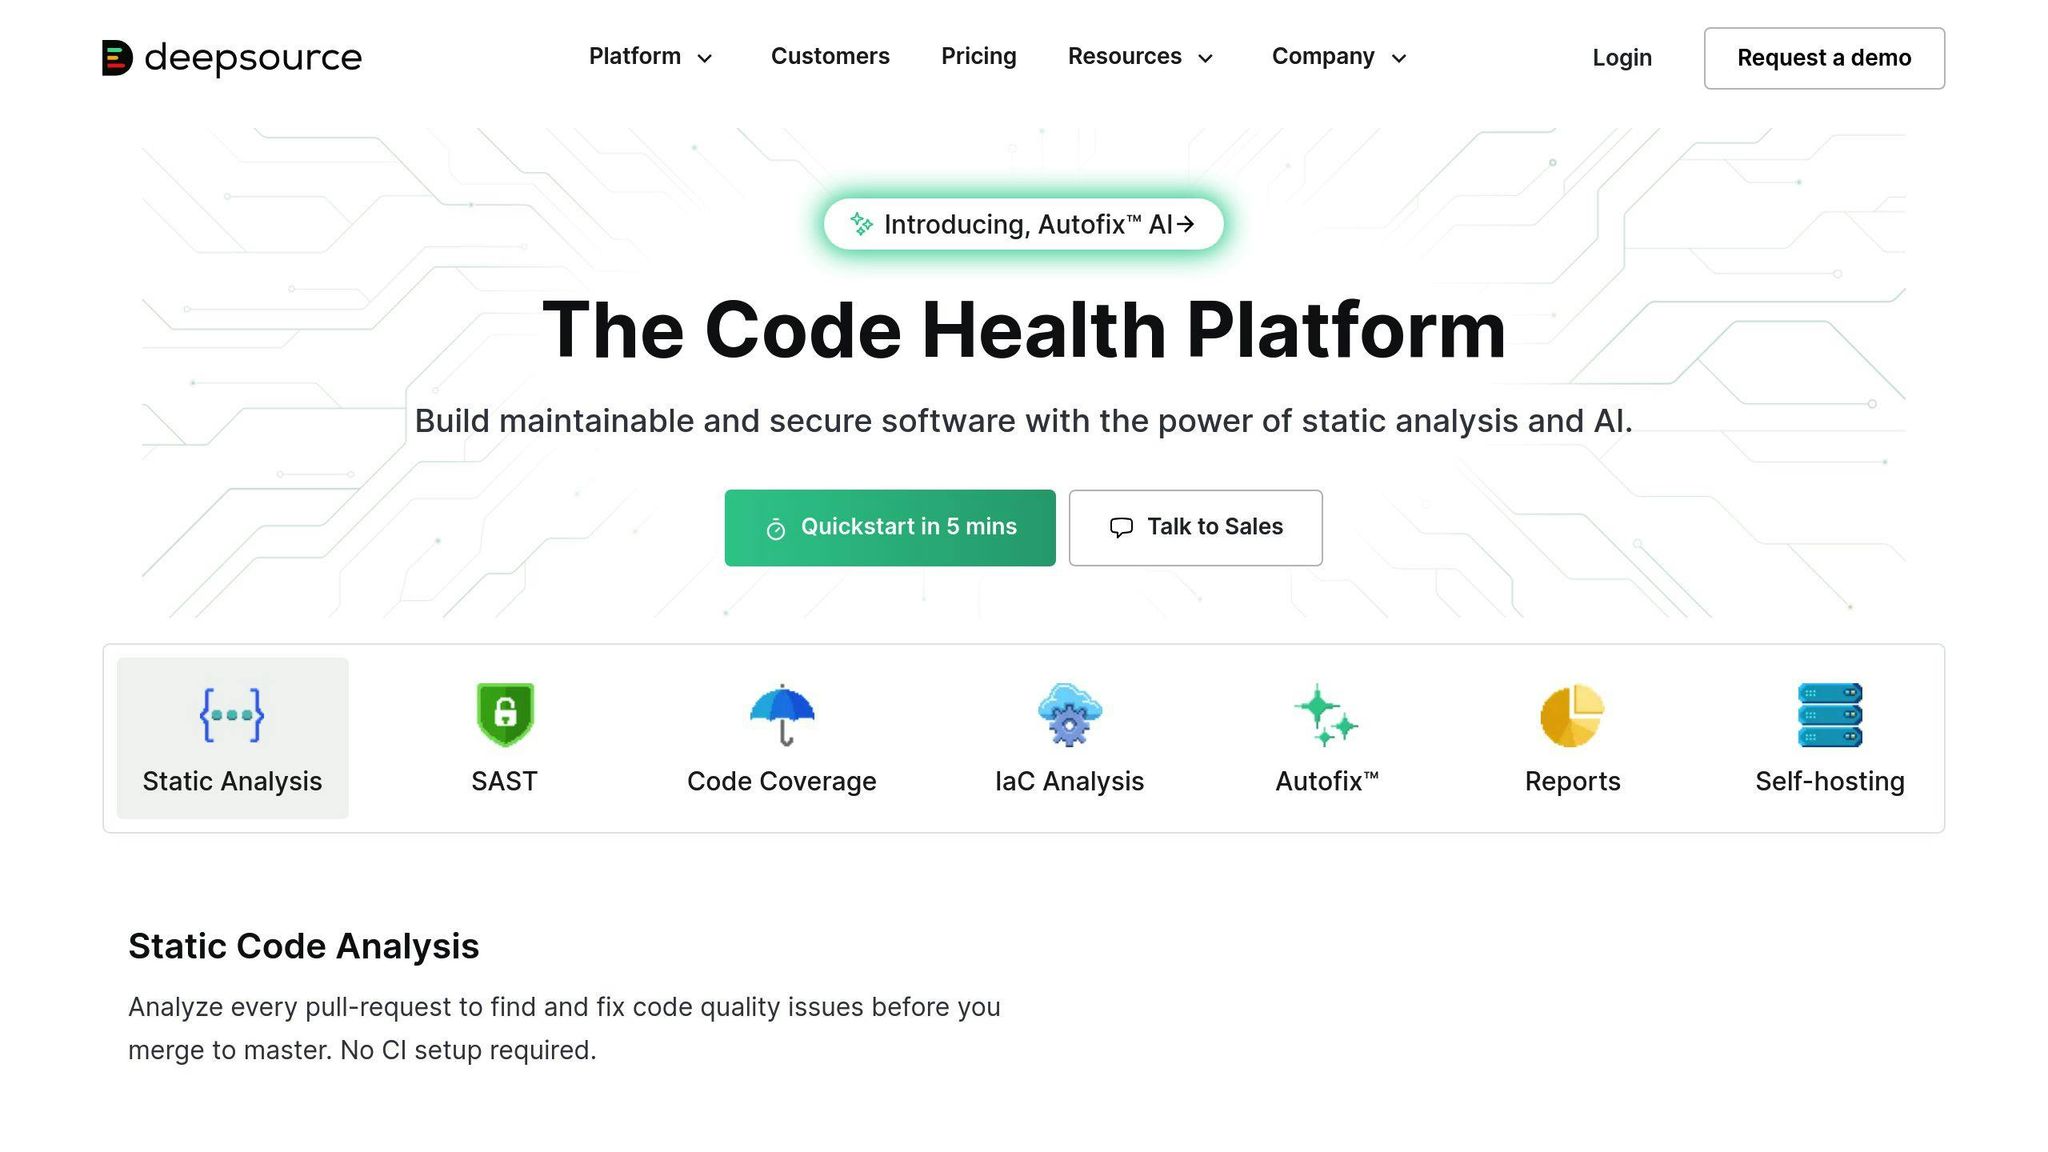
Works with GitHub, GitLab, and Bitbucket.
A startup CTO shared: "DeepSource caught 15% more critical issues than our previous tool, boosting app performance."
When choosing, consider:
- Language support
- Integration options
- Reporting features
- Pricing
Conclusion
Tracking these 7 metrics helps spot issues early, prevent bugs, and build maintainable software. Real-world impacts:
| Company | Metric | Result |
|---|---|---|
| Cyclomatic Complexity | 20% fewer bug reports in 6 months | |
| Microsoft | Maintainability Index | 15% faster developer onboarding |
| Amazon | Cognitive Complexity | 30% less code review time |
A startup CTO reported: "After tracking Halstead Complexity, our sprint velocity jumped 25%."
Remember, metrics are tools, not rules. Quick action plan:
- Pick 2-3 metrics to start
- Set up automated tracking
- Review weekly
- Act on insights
The goal is better code, not perfect code. Start tracking today - your future self will thank you.
FAQs
What are code complexity metrics?
Quantitative measures of code difficulty:
- Cyclomatic Complexity
- Lines of Code (LOC)
- Halstead Complexity Measures
- Maintainability Index
- Cognitive Complexity
- Depth of Inheritance
- Coupling Between Objects
What tools measure code complexity?
Options include:
- SourceMonitor (free, open-source)
- Cloc (command-line)
- Metrix++ (extendable)
- SonarQube (open-source platform)
- CodeClimate (cloud-based)
What measures code complexity?
Different metrics focus on various aspects:
- Cyclomatic Complexity: independent code paths
- LOC: code size
- Halstead Volume: program length based on operators/operands
- Maintainability Index: ease of maintenance
- Cognitive Complexity: understandability
What are main code quality metrics?
Key metrics include:
- Cyclomatic Complexity
- Code Churn
- Technical Debt Ratio
- Test Coverage
These help evaluate and improve code quality, reduce bugs, and enhance maintainability. A study found teams with lower code churn (under 8%) outperformed those with higher rates (over 11%).

.png)


