.png)


.png)


Recently I needed to identify potential memory leaks in a Windows application running in an AWS environment. CloudWatch metrics were used to be able to store this information over time for business leaders to be able to identify performance over time in our web server application. Below I will explain how I set up CloudWatch on our Windows servers as well as how I configured CloudWatch to monitor specific performance counters that might indicate application memory leaks.
Identifying Performance Monitor Performance Counters
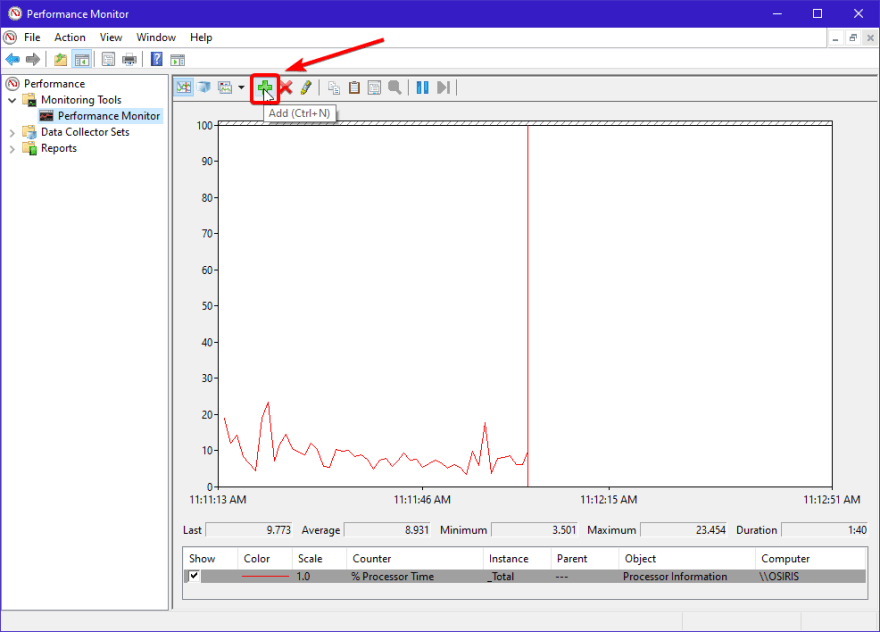
Search for "Perfmon" in the Windows search bar and open it.
Click the + sign to add a performance counter:
Click on "Process", then select the process name which you would like to monitor.
Click Add
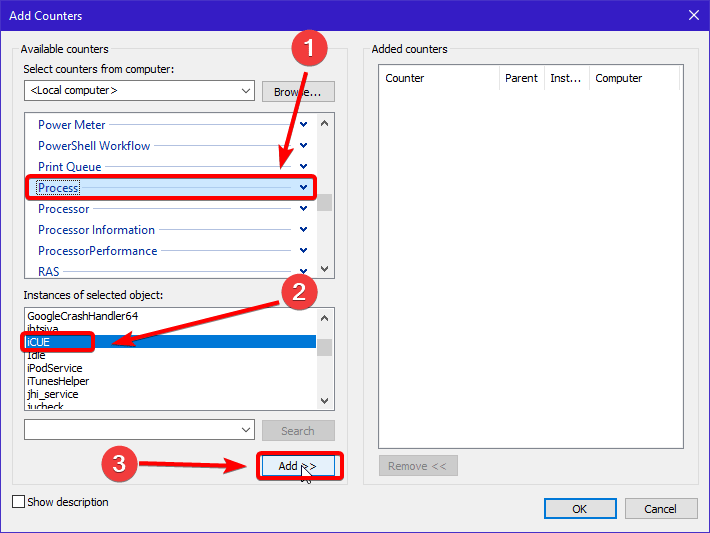
Click "Ok" at the bottom right hand of the window.
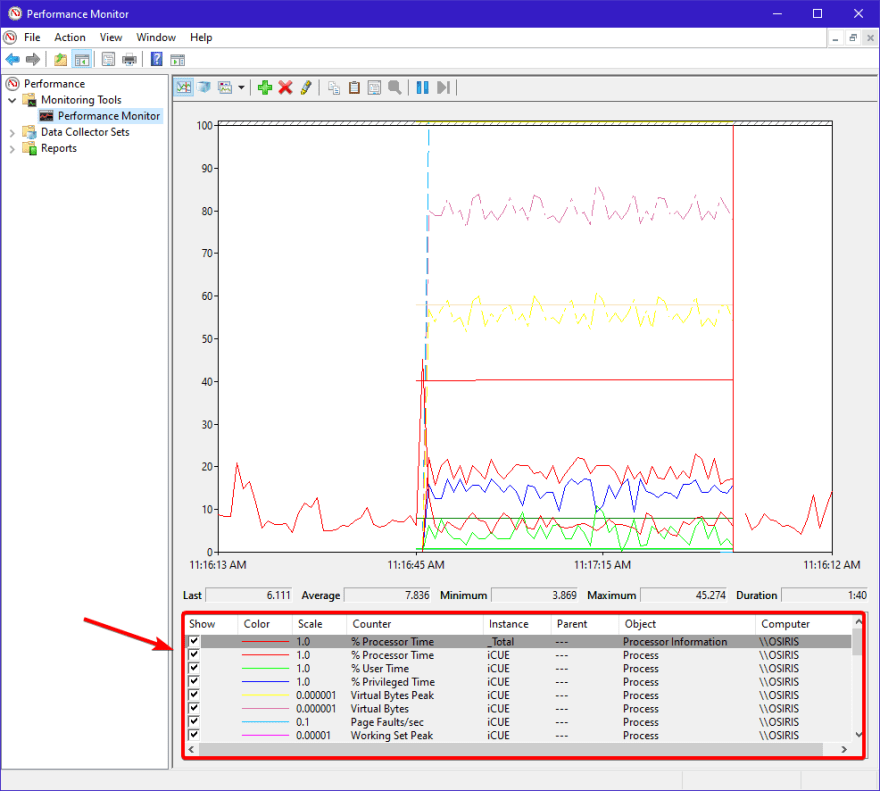
Performance Monitor will now start monitoring all of the counters for that specific process. This is the information we will use to monitor specific memory conditions of our application.
CloudWatch Agent Installation
You will need to install the CloudWatch Agent on the AWS EC2 instance in order for CloudWatch to start logging metrics.
CloudWatch Agent for Windows
CloudWatch User Guide
Your EC2 instance must have the AWS Managed role called 'CloudWatchAgentServerPolicy' attached to it. Instructions on how to do that can be found here.
CloudWatch Agent Configuration
Open your File Explorer and navigate to 'C:\ProgramData\Amazon\AmazonCloudWatchAgent\Configs'.
Save the below JSON to a file called 'config.json'.
This will monitor the Chrome process and will put the logs into the CWAgent namespace in us-east-1. Edit agent.region in the config.json for the region in which your EC2 instance is located. For example: us-west-2, eu-west-1, etc.
Copy the 'config.json' from the previous step into 'C:\ProgramData\Amazon\AmazonCloudWatchAgent\Configs'.
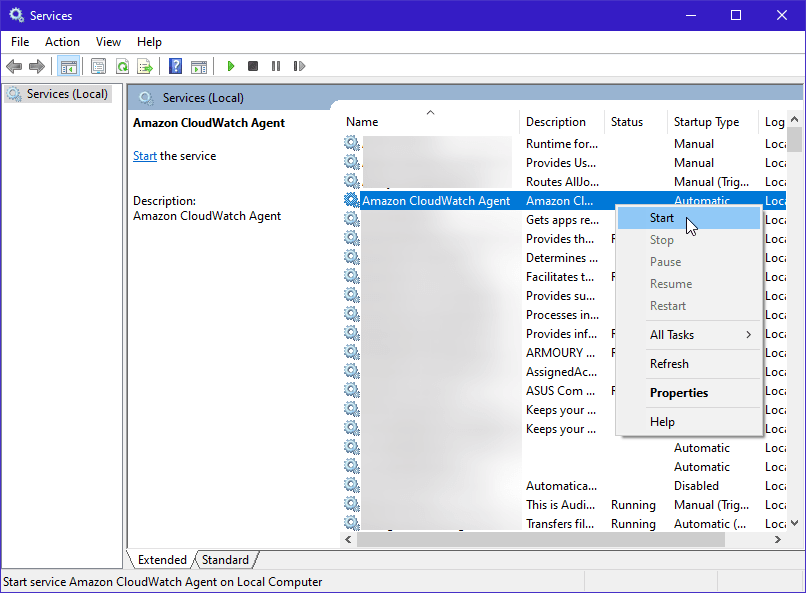
Start the CloudWatch Agent Service.
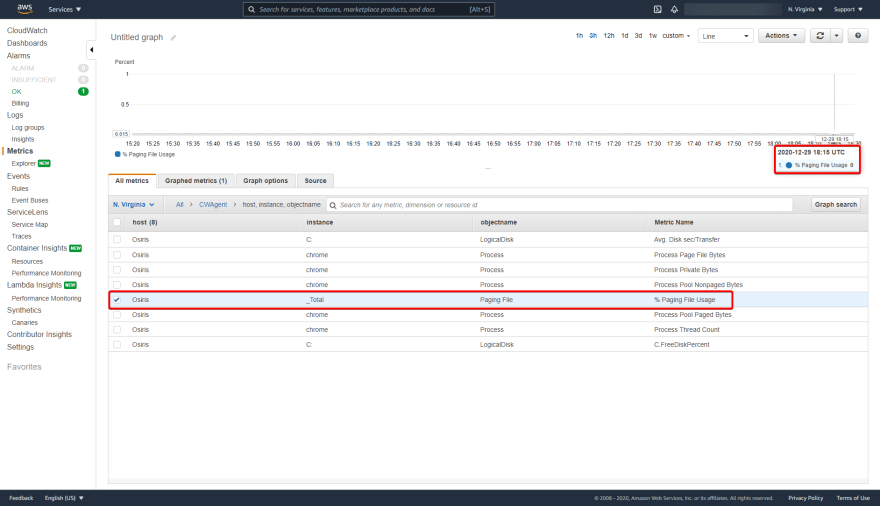
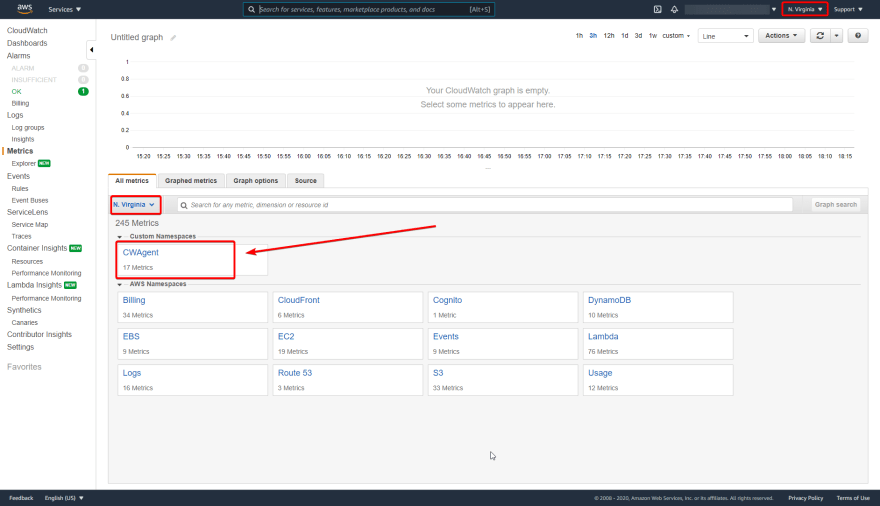
In a few minutes you should start seeing metrics show up in CloudWatch under the CWAgent namespace in us-east-1.
Metric Explanation
Below I will outline why we are logging specific metrics:
metrics/Memory
Pages/sec - Pages/sec is the rate at which pages are read from or written to disk to resolve hard page faults.
We are logging the memory counter "Pages/sec" and the LogicalDisk counter "Avg. Disk sec/Transfer" because if the product of these counters exceeds 0.1, paging is taking more than 10 percent of disk access time. That can cause problems and can indicate some form of a memory leak.
metrics/Paging File
% Paging File Usage - Displays the percentage of the paging file that is currently in use. If your counter shows that your paging file has reached or is nearing 100% current usage, then your system and applications will not be able to function properly, and your computer will lag and have slow processing speed. You want your paging file to be large enough that, at any given time, only 50% to 75% of it is being used at most, although even lower numbers are preferred.
We are logging "Paging File\% Usage" and "Paging File\%" because if any one of these values increase gradually over time it indicates a memory leak.
metrics/Process
Page File Bytes - The amount of data (in bytes) stored in virtual memory which the process has reserved for use in the paging file(s). An increase in the page file over time indicates a memory leak.
Process Pool Paged Bytes - Virtual memory that can be paged in and out of the system.
Process Pool Nonpaged Bytes - Virtual memory addresses that reside in physical memory as long as the corresponding kernel objects are allocated.
If we do have a memory leak we can identify which process (and when) by monitoring the following counters "Process\Page File Bytes", "Process\Pool Nonpaged Bytes", "Process\Pool Paged Bytes", "Process\Private Bytes", and "Process\Thread Count".
Microsoft Documentation - Monitoring Infrastructure Health
metrics/procstat
cpu_time - The amount of time that the process uses the CPU. This metric is measured in hundredths of a second.
memory_rss - The amount of real memory (resident set) that the process is using.
memory_vms- The amount of virtual memory that the process is using.
CloudWatch Procstat Documentation