In this post, I want to share my insights about how I built a small service called Langauge (it's not a typo, thank you Grammarly) with the Injex Framework and Injex Express Plugin.
In this post, I want to share my insights about how I built a small service called Langauge (it's not a typo, thank you Grammarly) with the Injex Framework and Injex Express Plugin.
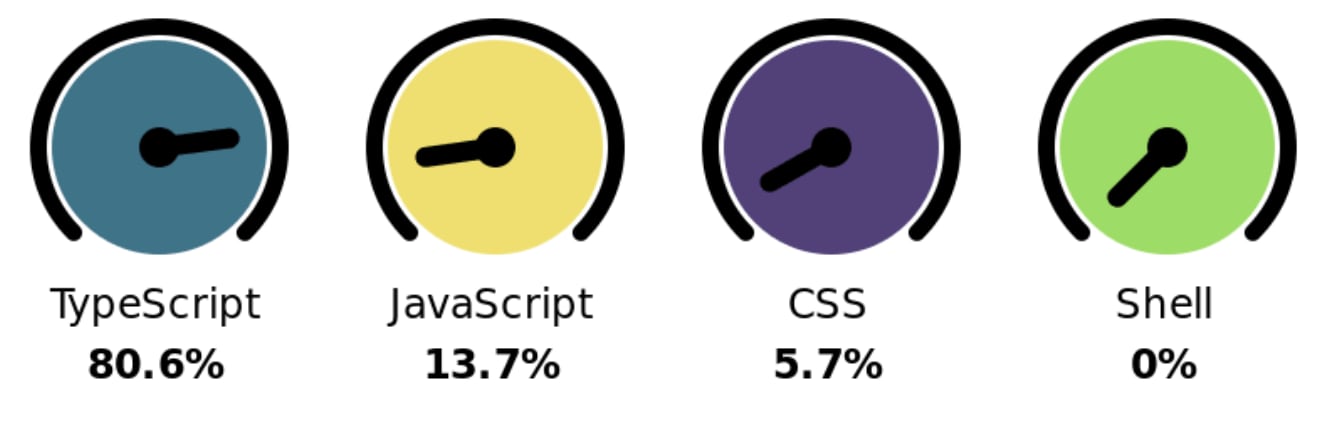
With Langauge, you add a colorful badge of gauges displaying the programming languages you used in a particular GitHub repository. You can add it to your markdown files or your website, share it as an image on social media and even print it and put it on the wall! 😄
The Motivation
Every GitHub repository has a colorful language bar at the right panel of its home page. For example, here is the language bar of Quickey, another open-source project of mine.
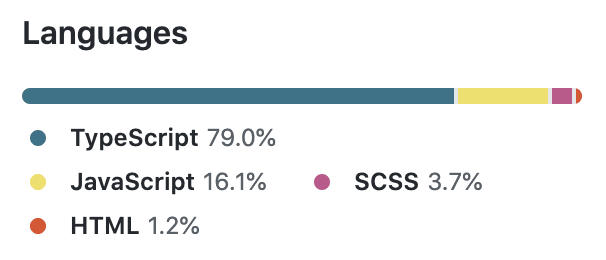
So why bother and create Langauge, you ask? Well, because I want to show off my skills in some other places, of course :)
Let's take Quickly for another example, Quickey is a module that can be installed via NPM. Please go and check it out for a second...
Welcome back! Have you noticed something is missing there? Right! It's the colorful language bar we saw earlier! It's a GitHub feature, so we can't see it on the project's NPM page nor any other place outside the repository's home page.
So here's ladies and gentlemen, the motivation!
Roadmap
So, with that motivation in mind, let's meet the tools we're going to use to create this colorful ballet.
Data
To display these gauges, we need a way to fetch the number of bytes partitioned by a given GitHub repository's programming languages. This is the easy part since we are dealing with GitHub repositories here. The GitHub API is the place to look at, and guess what? GitHub already thought about us and has a great resource just for that. Fetching repository bytes, partitioned by its programming languages, is easy as sending a GET request to https://api.github.com/repos/quickey/quickey/languages.
The response is:
{
  "TypeScript": 57718,
  "JavaScript": 11731,
  "CSS": 2708,
  "HTML": 899
}
Colors
Colors are the smiles of nature — Leigh Hunt
Each language in GitHub's repository language bar has a unique color. For example, JavaScript's color is lightish yellow (#ECE066), CSS's is dark purple (#503F7A). Can you see the problem here? How many programming languages and technologies do you know? Moreover, how many there are? My guess is it's too much. Again with the help of GitHub, quick research, and I found this repository called Linguist.
Linguist's source code includes a YAML file with all the languages and technologies ever known to GitHub with some metadata on each of them, including a unique color! I created a simple script, so it's easy to fetch that YAML, convert it to JSON, and save it as a module within my source code.
#!/usr/bin/env node

const yamljs = require("yamljs")
    , axios = require("axios")
    , path = require("path")
    , fs = require("fs")
    , LANGUAGES_YML_URL = "https://raw.githubusercontent.com/github/linguist/master/lib/linguist/languages.yml"
    , DESTINATION_PATH = path.resolve(__dirname, "../data/languages.js");

(async () => {
    try {
        const response = await axios.get(LANGUAGES_YML_URL)
            , json = yamljs.parse(response.data)
            , raw = JSON.stringify(json, null, 4);

        fs.writeFileSync(DESTINATION_PATH, `module.exports = ${raw};`);
    } catch (err) {
        console.error("- failed to fetch and parse languages yml", err);
    }
})();
The Gauge
Now that we have the data and the colors, we can go and create our gauges!
A few weeks ago, I started playing with the Sketch App. One thing I like about Sketch is the ability to create vector shapes and export them as SVG.
Opening Sketch, creating some vectors, adding some text, and after 10 minutes, I had this nice gauge!
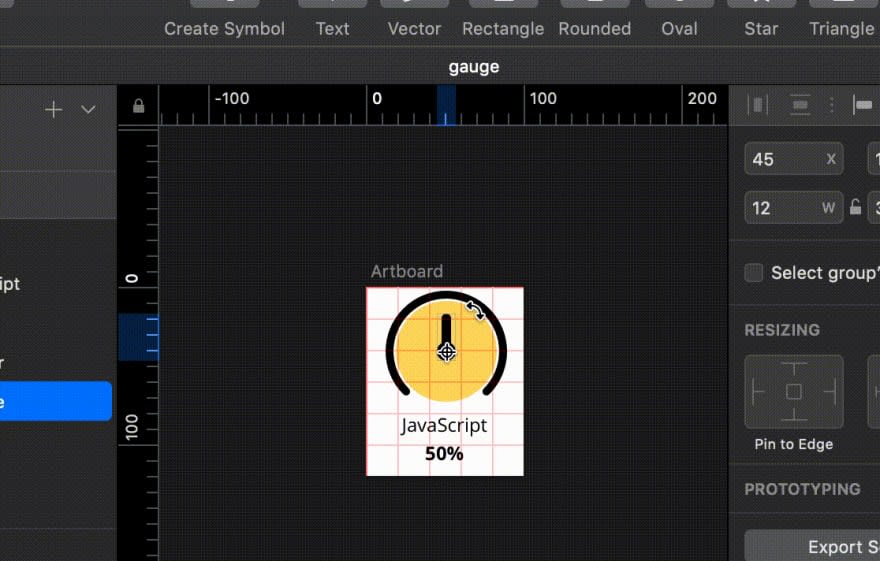
After exporting this gauge to SVG and cleaning it a little bit, I ended up with the following code:
<svg width="100px" height="120px" viewBox="0 0 100 120" version="1.1" xmlns="http://www.w3.org/2000/svg" xmlns:xlink="http://www.w3.org/1999/xlink">
    <g stroke="none" stroke-width="1" fill="none" fill-rule="evenodd">
        <g transform="translate(0.000000, -10.000000)">
            <circle fill="#FFDA76" cx="51" cy="51" r="32"></circle>
            <g transform="translate(45.000000, 27.000000)" fill="#000000">
                <path d="M6,0 L6,0 C7.65685425,-3.04359188e-16 9,1.34314575 9,3 L9,21 C9,22.6568542 7.65685425,24 6,24 L6,24 C4.34314575,24 3,22.6568542 3,21 L3,3 C3,1.34314575 4.34314575,3.04359188e-16 6,0 Z"></path>
                <circle cx="6" cy="24" r="6"></circle>
            </g>
            <path d="M51,87 C70.882251,87 87,70.882251 87,51 C87,31.117749 70.882251,15 51,15 C31.117749,15 15,31.117749 15,51" stroke="#000000" stroke-width="5" stroke-linecap="round" stroke-linejoin="round" transform="translate(51.000000, 51.000000) rotate(-45.000000) translate(-51.000000, -51.000000) "></path>
        </g>
        <text font-family="OpenSans-Regular, Open Sans" font-size="12" font-weight="normal" fill="#000000">
            <tspan x="22.8066406" y="92">JavaScript</tspan>
        </text>
        <text font-family="OpenSans-Bold, Open Sans" font-size="12" font-weight="bold" fill="#000000">
            <tspan x="37.7451172" y="110">50%</tspan>
        </text>
    </g>
</svg>
From static SVG to dynamic PNG
I like SVG because it stands for Scalable Vector Graphics, which means I can take the gauge SVG, resize it to huge dimensions, and the quality remains the same as in its original size. Another thing is that SVG is made of pure and readable XML. Just like in HTML, each shape or label is created with a markup element.
The idea is to take this SVG markup and change it so that I can set the language, percentage, color, and gauge rotation dynamically. After that, I need to take this SVG and convert it into an image format like PNG.
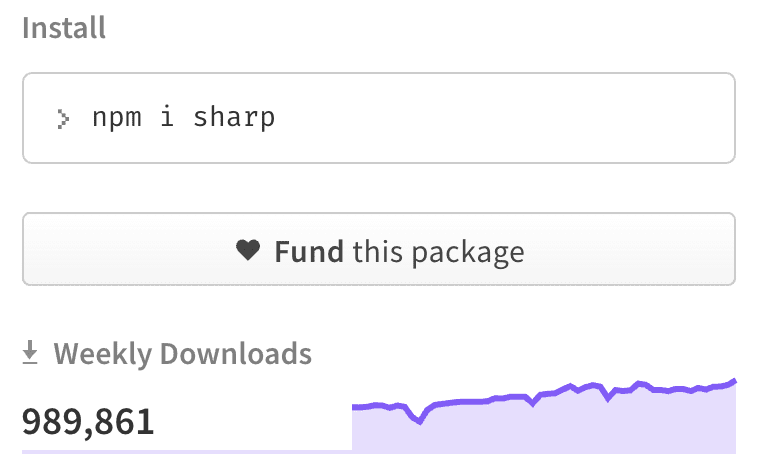
Since I'm using JavaScript and NodeJS, a quick search in the NPM registry and I found Sharp, a library that takes an SVG as an input and converts it into various image formats and sizes.
Connecting the dots
After we met the tools we're going to use for developing the Langauge service, Let's explore the edges and see how we can put together these vertices.
Choosing the right web framework
As I said earlier in this post, I use NodeJS as the backend for the Langauge service. I used to work with Express as a web framework. Still, I felt that something is missing. This is why I created Injex, a dependency-injection framework for TypeScript applications.
Injex includes a dependency-injection IoC container powered by a plugin system, so you can use Injex plugins or, if you like, create your own plugins.
The Injex Express Plugin makes express application development look and feel more elegant.
Our service has only one endpoint, the one that gets a repository owner and name and responds with a colorful gauges image of the programming languages used on the repository. I won't go over the entire source code in this post, and you can go and read it by yourself. Instead, I'll cover the service domain parts.
The request model
Each request to Langauge can be customized with options like disable colors, set the number of columns, and more. I'm going to use TypeScript interfaces to describe the request model.
export interface ILangaugeOptions {
    type: GaugeType;
    output: OutputFormat;
    threshold: number;
    colors: boolean;
    columns: number;
    scale: number;
}

export interface IRequestModel extends ILangaugeOptions {
    owner: string;
    repo: string;
    maxAge: number;
}
Controller
The controller handles each incoming GET request to /:owner/:repo. The render method receives the express Request and Response arguments and passes the model to the manager to render the image.
@define()
@singleton()
@controller()
export class LangaugeController {

    @inject() private langaugeManager: LangaugeManager;

    @get("/:owner/:repo")
    @middleware(RequestValidationMiddleware)
    public async render(req: ILangaugeRequest, res: Response<Buffer>) {

        res.setHeader("Content-Type", OutputFormatContentType[req.model.output]);
        res.setHeader("Content-Encoding", "gzip");
        res.setHeader("Cache-Control", `max-age=${req.model.maxAge}`);

        const bitmapBuffer = await this.langaugeManager.generate(req.model.owner, req.model.repo, req.model);
        const buffer = await gzip(bitmapBuffer);

        res.send(buffer);
    }
}
We define the LangaugeController class as an Injex Controller by using the @controller() decorator. The render method is defined as a @get() handler for the /:owner/:repo route with the RequestValidationMiddleware as the request validator middleware. If the validator fails, an error returns to the client.
We then invoke the generate method of the language manager with the request model, and the result is sent to the client as an image.
public async generate(owner: string, repo: string, options: ILangaugeOptions): Promise<Buffer> {
    try {
        const createRenderer = this.rendererCreators[options.type];

        let languages = await this.githubService.getRepositoryLanguages(owner, repo);

        if (options.threshold) {
            languages = this.thresholdLanguagesFilter(languages, options.threshold);
        }

        const totalBytes = _(languages).values().sum();

        const renderer = createRenderer(options, totalBytes, languages);

        return await renderer.render();

    } catch (err) {

        this.$injex.logger.error(`failed to render langauge for type ${options.type}`, err);

        return Buffer.from("");
    }
}
The generate method receives the git owner and repo with the rest of the model options as arguments. In line 3, we take the renderer creator from a dictionary of creators, each renderer creator in the rendererCreators dictionary is indexed by the type option. Line 5 fetches the repository languages from the GitHub API, as we saw earlier in the roadmap section. We then use the threshold option to filter out any language usage percentage below this value. In line 15, the render method is invoked and returns a bitmap buffer, which then returned from the generate method.
SVG Template
Before we can render, we need a template for the SVG to change it dynamically and compile it with different data. I'm using Handlebars for this task. Handlebars provide the power necessary to let you build semantic templates effectively with no frustration. So I took the SVG generated from Sketch as we saw at the roadmap, and converted it into this Handlebars template:
<svg viewBox="0 0 {{width}} {{height}}" version="1.1" xmlns="http://www.w3.org/2000/svg"
    xmlns:xlink="http://www.w3.org/1999/xlink">

    {{#each languages}}
    <g transform="translate({{this.translateX}}, {{this.translateY}})" stroke="none" stroke-width="1" fill="none"
        fill-rule="evenodd">
        <g transform="translate(0, -10.000000)">

            <circle fill="{{this.color}}" cx="51" cy="51" r="32"></circle>

            <g transform="translate(45.000000, 27.000000) rotate({{this.rotation}}, 6, 24)" fill="#000000">

                <path
                    d="M6,0 L6,0 C7.65685425,-3.04359188e-16 9,1.34314575 9,3 L9,21 C9,22.6568542 7.65685425,24 6,24 L6,24 C4.34314575,24 3,22.6568542 3,21 L3,3 C3,1.34314575 4.34314575,3.04359188e-16 6,0 Z">
                </path>

                <circle cx="6" cy="24" r="6"></circle>
            </g>

            <path
                d="M51,87 C70.882251,87 87,70.882251 87,51 C87,31.117749 70.882251,15 51,15 C31.117749,15 15,31.117749 15,51"
                stroke="#000000" stroke-width="5" stroke-linecap="round" stroke-linejoin="round"
                transform="translate(51.000000, 51.000000) rotate(-45.000000) translate(-51.000000, -51.000000) ">
            </path>

        </g>

        <text text-anchor="middle" font-family="'OpenSans-Regular, Open Sans'" font-size="12" font-weight="normal"
            fill="#000000">
            <tspan x="50" y="92">{{this.language}}</tspan>
        </text>
        <text text-anchor="middle" font-family="'OpenSans-Bold, Open Sans'" font-size="12" font-weight="bold"
            fill="#000000">
            <tspan x="50" y="110">{{this.percent}}%</tspan>
        </text>
    </g>
    {{/each}}
</svg>
As you can learn from this template file, we are going to compile it with this schema:
{
    // SVG box width
    width: number;

    // SVG box height
    height: number;

    // Array of languages
    languages: [{
        // X position translation
        translateX: number;

        // Y position translation
        translateY: number;

        // Gauge color
        color: string;

        // Gauge needle rotation
        rotation: number;

        // Language name
        langauge: string;

        // Usage in percents
        percentage: number;
    }]
}
Wrapping everything up
Now let's take a look at the renderer's code to see how it takes our handlebars template and converts it into an image of colorful gauges.
protected async _render(): Promise<sharp.Sharp> {
    const languages = this.hydrateRendererLanguages()
        , totalLanguages = languages.length
        , [width, height] = this.calculateCanvasSize(totalLanguages)
        , destWidth = width * this.options.scale
        , destHeight = height * this.options.scale
        , dpi = DEFAULT_DPI * destWidth / width
        , svg = Buffer.from(handlebars.compile(SOLID_TEMPLATE)({ languages, width, height }));

    return sharp(svg, { density: dpi })
        .resize(destWidth, destHeight);
}
Upon creation, the renderer receives the original options from the request model, the total bytes for each language, the object key is the language name, and the value is the number of bytes from the total bytes.
First, I need to take this object and convert it into an array of languages with more properties like the color and the percentage of total bytes. The code is straight forward. I'm using Lodash reduce to convert the JSON object to an array:
return _.reduce(languagesBytes, (result: IRendererLanguage[], bytes: number, language: string) => {

    const percent = bytes / this.totalBytes * 100;

    result.push({
        language,
        bytes,
        percent: parseFloat(percent.toFixed(1)),
        color: this.getLanguageColor(language)
    });

    return result;
}, []);
Now that I have the array of languages with colors and percentages, I can compile the handlebars template.
I need to hydrate each one of the languages with translateX, translateY, and rotation properties. The hydrateRendererLanguages method calculates the position and rotation of each gauge in the SVG.
private hydrateRendererLanguages(): Array<IRendererLanguage & { rotation: number; translateX: number; translateY: number; }> {
    const results = [];
    const languagesRows = _.chunk(this.languages, this.options.columns);

    let currentLanguage: IRendererLanguage;

    for (let i = 0, rows = languagesRows.length; i < rows; i++) {

        for (let j = 0, columns = languagesRows[i].length; j < columns; j++) {

            currentLanguage = languagesRows[i][j];

            results.push({
                ...currentLanguage,
                rotation: currentLanguage.percent / 100 * (ROTATION_EDGE_DEGREE * 2) - ROTATION_EDGE_DEGREE,
                translateX: j * GAUGE_WIDTH,
                translateY: i * GAUGE_HEIGHT
            });
        }
    }

    return results;
}
As you can see, I'm using the Lodash chunk function to create a matrix of columns and rows based on the columns option (line 3). The default value is the number of languages, so we get only one row if there is no value for columns.
In lines 7 and 9, I'm iterating the matrix to calculate the translations. Remember the gauge I created in Sketch? Its needle points to the north at 0°. I need to translate it so that 0% = -135° and 100% = 135°, so the rotation value is calculated in line 15. The translations of X and Y are pretty simple, and both are calculated in lines 16 and 17, respectively.
Let's get back to the renderer. Now that we have the hydrated languages array, we need to compile the template and send it to Sharp to do the rest.
The results
To see the final result, go to https://badge.langauge.io/:OWNER/:REPO to see your project Langauge badge!
For example, here is the Langauge badge for Injex:
https://badge.langauge.io/uditalias/injex
Summary
So, to sum it up, we just saw how to combine the data from GitHub API, the colors from Linguist (an open-source project by GitHub), minimal Sketch skills, and the Sharp library to create a colorful badge of gauges. We then saw how to build a server with the Injex Framework to manage the application modules and dependencies.
I hope you enjoyed the way I built this service. I suggest you go and check out the source code repository. I'll appreciate your feedback about the service and be grateful for any contribution.
For convenience, you can test a live working version of this service in this Codesendbox:
Happy Coding!