A step-by-step guide to setting up zero-code observability on Red Hat OpenShift using the Red Hat build of OpenTelemetry. Covers installing the OTel operator, creating a collector instance, configuring the Instrumentation CR for auto-instrumentation across Java, Python, and Node.js apps via simple pod annotations, integrating with Tempo for distributed tracing, connecting to OpenShift User-Workload Monitoring for Prometheus metrics, and building dashboards with Perses. Includes YAML configurations, RBAC setup, and PromQL examples for key performance metrics.
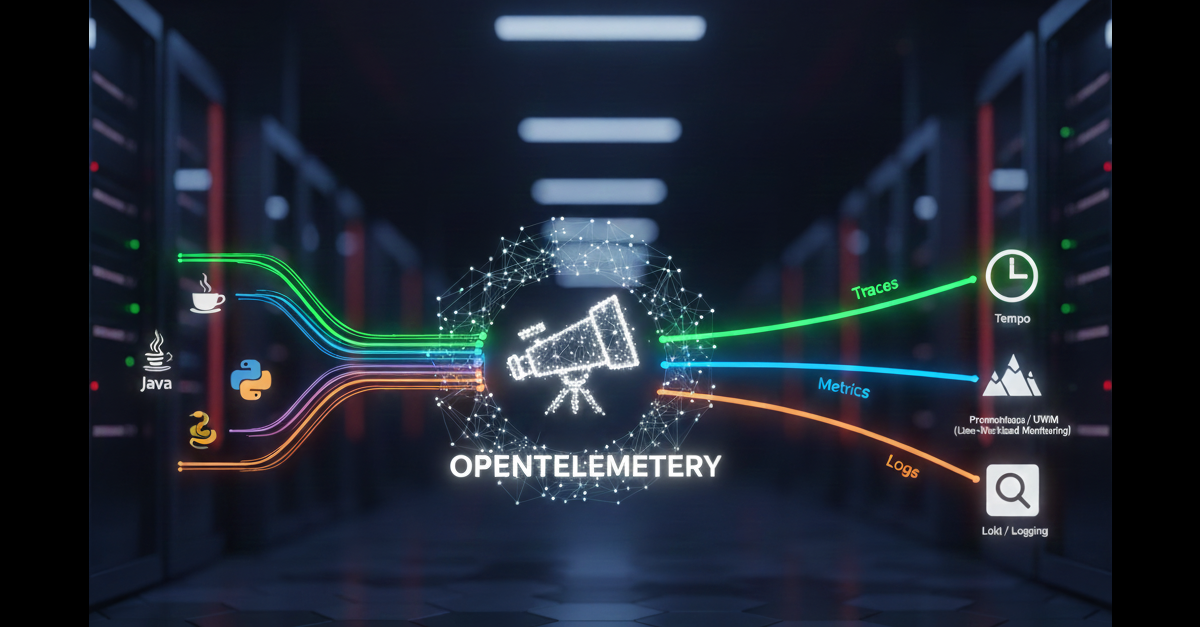
Table of contents
Auto-instrumentation is a game changerStep 1: Install the operatorStep 2: Create a collector instanceStep 3: Auto-instrumentation (the magic part)Step 4: Multi-language deployment & auto-instrumentationStep 5: Verify the flowIntegrate OpenTelemetry with TempoIntegrate OpenTelemetry with User-Workload-MonitoringModern dashboards with PersesWhat’s next226 Impressions