.png)


Explore the transformative approach of Diagrams as Code (DaC) for developers, enabling seamless generation, collaboration, and version control of visual documentation.
Diagrams as Code (DaC) is a revolutionary approach that allows developers to create visual documentation directly from their coding environments. By writing code to define the structure, relationships, and visual representation of diagrams, developers can generate, update, and share diagrams seamlessly.
Key Benefits of DaC:
- Improved Collaboration: Store diagram code alongside project code, enabling seamless collaboration among team members.
- Version Control: Track changes and updates to diagrams over time, ensuring consistency with the codebase.
- Consistency: Ensure consistency across diagrams, reducing errors and inconsistencies.
Getting Started with DaC:
- Choose a DaC tool like PlantUML, Graphviz, Mermaid, or Draw.io that aligns with your tech stack and diagramming needs.
- Learn the basic syntax for defining diagram elements, such as nodes, edges, and relationships.
- Start with a simple diagram, like a flowchart or sequence diagram, and gradually add complexity.
- Integrate your diagram into your development workflow, using it to communicate with team members and stakeholders.
Best Practices:
| Best Practice | Description |
|---|---|
| Simple and Clear Diagrams | Prioritize simplicity and clarity in diagrams. |
| Documenting with Comments | Use comments to explain diagram components and relationships. |
| Versioning Diagrams with Architecture | Ensure consistency in versioning between code and diagrams. |
| Collaborative Diagramming | Store diagram code alongside project code and encourage collaboration. |
| Regular Diagram Reviews | Regularly review and validate diagrams to maintain accuracy. |
| Coding Standards for Diagrams | Follow coding standards for diagram code readability and maintainability. |
By integrating Diagrams as Code into your workflow, you'll experience a significant improvement in the accuracy, consistency, and collaboration of your documentation.
How Diagrams as Code Work
Visual Documentation in Software Development
In software development, visual documentation is crucial for understanding complex systems and communicating ideas effectively. Diagrams, flowcharts, and other visual aids help developers, architects, and stakeholders understand the architecture, design, and behavior of software systems.
Moving to Code-Generated Diagrams
Diagrams as Code (DaC) revolutionizes the way we create and manage visual documentation. By treating diagrams as code, developers can leverage the same principles and tools they use for writing software to generate and maintain diagrams.
Benefits of DaC
| Benefit | Description |
|---|---|
| Version control | Easily update, modify, and share diagrams with others |
| Consistency | Ensure consistency across diagrams, reducing errors and inconsistencies |
| Collaboration | Enable seamless collaboration among team members, allowing them to work together on diagrams and share knowledge more effectively |
By adopting DaC, developers can focus on the content and structure of their diagrams, rather than the visual aesthetics, leading to more efficient and effective documentation practices.
Benefits of Diagrams as Code
Diagrams as Code (DaC) offers several advantages that transform the way developers create, manage, and collaborate on visual documentation. By treating diagrams as code, developers can leverage the same principles and tools they use for writing software to generate and maintain diagrams.
Collaboration and Version Control
DaC enables seamless collaboration among team members by using tools like Git for version control. This allows multiple developers to work on the same diagram simultaneously, track changes, and maintain a version history. With DaC, diagrams become a part of the codebase, making it easier to manage and update them alongside the code.
Consistent and Reusable Diagrams
Coded diagrams ensure consistency across diagrams, reducing errors and inconsistencies. By using templates and pulling values from configuration files, developers can create reusable diagrams that are easily maintainable. This consistency also enables the creation of a unified visual language across the organization, making it easier for stakeholders to understand complex systems.
Integrating Diagrams with Development
DaC aligns perfectly with agile methodologies and continuous integration. By integrating diagrams with the codebase, developers can automate the generation of diagrams, ensuring that they are always up-to-date and accurate. This integration also enables the use of diagrams as a part of the testing and validation process, reducing errors and improving overall quality.
Key Benefits of DaC
| Benefit | Description |
|---|---|
| Collaboration | Enables seamless collaboration among team members |
| Consistency | Ensures consistency across diagrams, reducing errors and inconsistencies |
| Integration | Aligns with agile methodologies and continuous integration, automating diagram generation and testing |
By adopting DaC, developers can focus on the content and structure of their diagrams, rather than the visual aesthetics, leading to more efficient and effective documentation practices.
Building Blocks of Coded Diagrams
When implementing diagrams as code, it's essential to understand the fundamental components that make up a diagram. These building blocks come together to form a coherent infrastructure representation, enabling developers to create, manage, and collaborate on visual documentation efficiently.
Diagram Context and Structure
The 'Diagram' element serves as the encompassing context for all other components. It provides a hierarchical structure, allowing developers to organize and group related components logically.
Grouping with Clusters
Clusters are used to group resources logically, reflecting actual or planned infrastructure organization. This grouping mechanism enables developers to create a hierarchical representation of the infrastructure.
Nodes and Edges for Components
Nodes and edges are used to represent individual components and their connections. Nodes represent individual components, such as servers, databases, or applications, while edges represent the connections between them.
Diagram Components
| Component | Description |
|---|---|
| Diagram | Encompassing context for all other components |
| Clusters | Group resources logically, reflecting infrastructure organization |
| Nodes | Represent individual components, such as servers or databases |
| Edges | Represent connections between nodes |
By understanding these building blocks, developers can create, manage, and collaborate on visual documentation efficiently, leading to more effective infrastructure representation and maintenance.
Tools for Diagrams as Code
Developers have several tools at their disposal for creating diagrams as code. Here's an overview of some popular options, including their features, suitability for different tasks, and integration capabilities with other developer tools.
PlantUML for Diagram Types
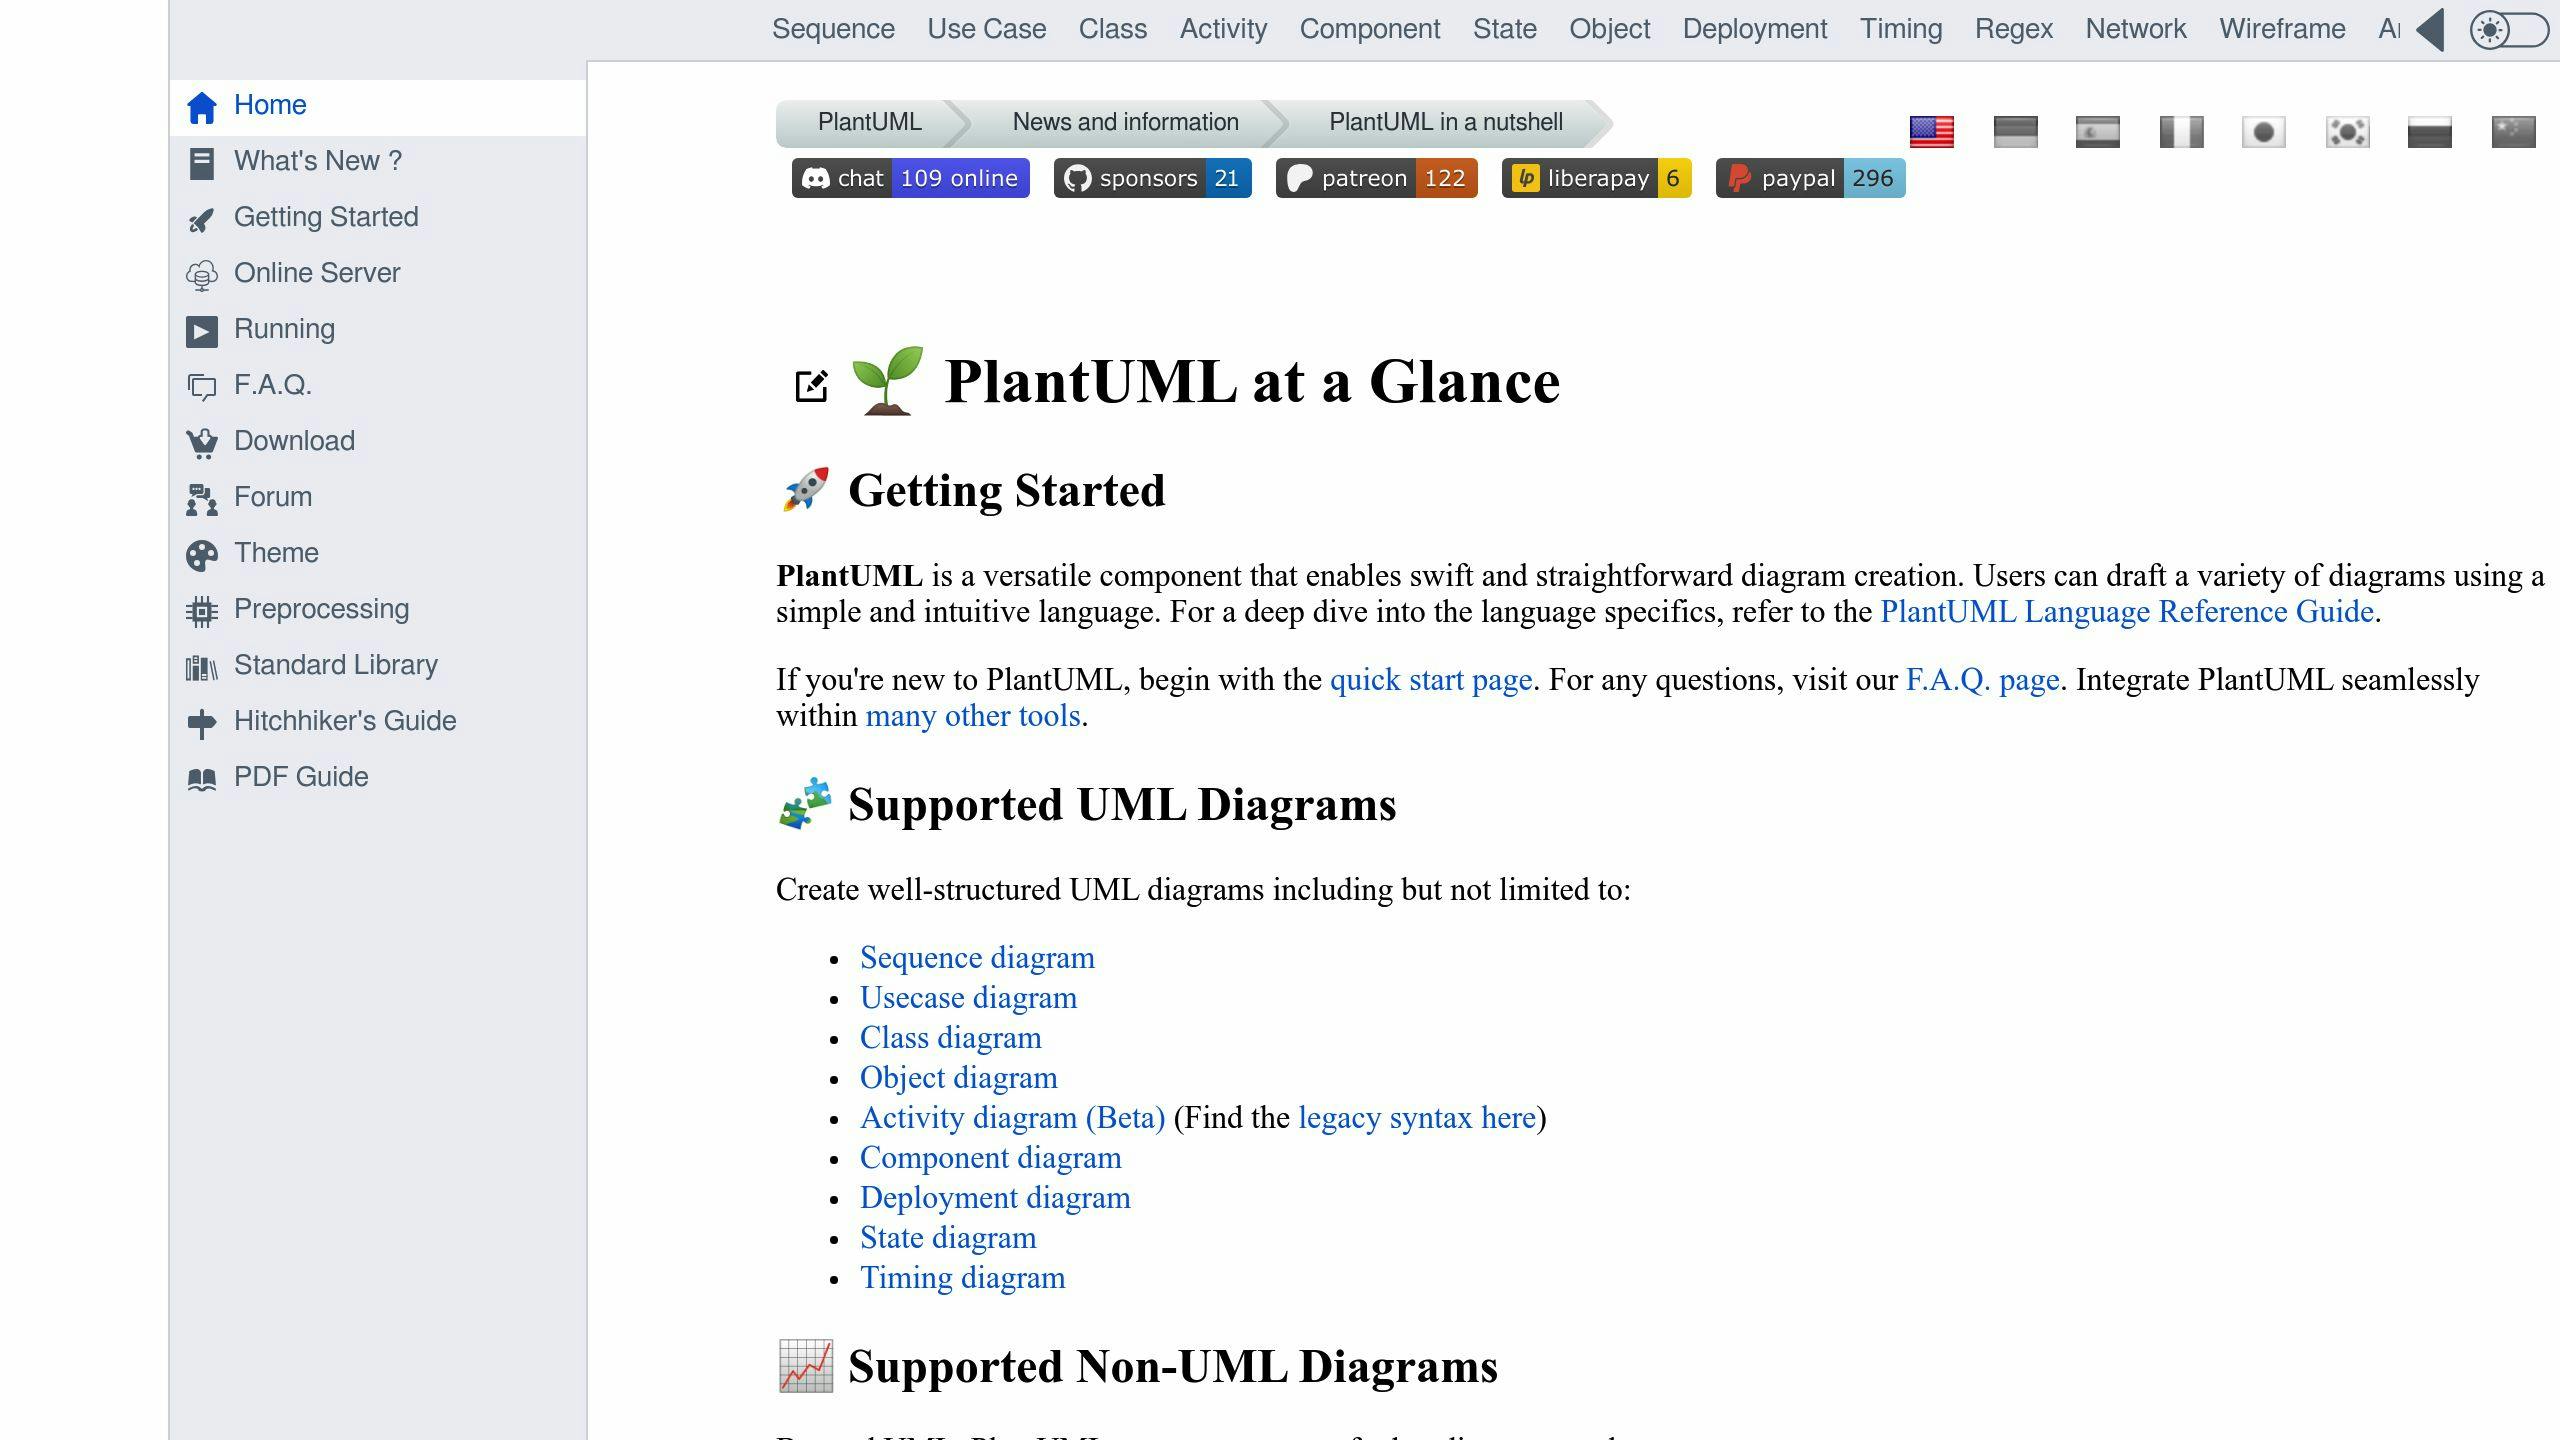
PlantUML is a versatile tool that supports a wide range of diagram types relevant to developers. It offers a domain-specific language (DSL) that allows developers to create various diagram types, including UML diagrams, sequence diagrams, flowcharts, and more.
| Diagram Type | Description |
|---|---|
| UML Diagrams | Class diagrams, use case diagrams, etc. |
| Sequence Diagrams | Interaction between objects over time |
| Flowcharts | Visual representation of algorithms and processes |
Graphviz for Network Diagrams

Graphviz is a powerful graph visualization tool that can be used for creating network diagrams, flowcharts, and more. It works with a DOT language for defining diagrams, making it easy to create complex diagrams with ease.
| Feature | Description |
|---|---|
| Network Diagrams | Visual representation of network architecture |
| Flowcharts | Visual representation of algorithms and processes |
| DOT Language | Easy to define diagrams using a simple language |
Mermaid for Web-Based Diagramming

Mermaid is a JavaScript-based library that enables creating diagrams and visualizations using text. It uses Markdown-style text definitions that feed into a renderer to create complex diagrams.
| Feature | Description |
|---|---|
| Web-Based Diagramming | Create diagrams directly in the browser |
| Markdown-Style Text | Easy to define diagrams using a simple syntax |
| Renderer | Converts text definitions into visual diagrams |
Draw.io for Web-Based DaC

Draw.io is a web-based diagramming tool that supports diagrams as code through its XML export/import functionality. Developers can create and edit diagrams in a visual interface and then export them as code for version control.
| Feature | Description |
|---|---|
| Web-Based Diagramming | Create diagrams directly in the browser |
| XML Export/Import | Export diagrams as code for version control |
| Visual Interface | Easy to create and edit diagrams |
Python Diagrams Library

The Python Diagrams Library is a Python tool that lets developers draw cloud system architectures in code. Designed for rapid prototyping, it eliminates the need for separate diagramming tools.
| Feature | Description |
|---|---|
| Cloud System Architectures | Visual representation of cloud infrastructure |
| Rapid Prototyping | Quickly create and test diagrams |
| Python Tool | Easy to integrate with existing Python workflows |
By understanding the features and capabilities of these tools, developers can choose the best fit for their diagramming needs and integrate them seamlessly into their development workflow.
sbb-itb-bfaad5b
Best Practices for Diagrams as Code
Simple and Clear Diagrams
When creating diagrams as code, prioritize simplicity and clarity. Avoid complex visualizations that can confuse readers. Instead, use meaningful names for components and connections, and consider adding comments or annotations to provide additional context where necessary. Strive for diagrams that anyone can understand at a glance.
Documenting with Comments
Comprehensive documentation is crucial for diagrams as code. Comments and annotations are essential here. Explain the purpose and function of each component, connection, and relationship in your diagram. Think of your documentation as a user manual for your diagrams, helping others interpret and use them correctly.
Versioning Diagrams with Architecture
Consistency in versioning between your code and diagrams is critical. Ensure that changes made to your system or architecture are reflected in both your codebase and diagrams simultaneously. This alignment makes it easier to track the evolution of your system and prevents discrepancies between documentation and the actual implementation.
Collaborative Diagramming
Promote collaboration among team members by storing diagram code alongside project code in the same repository. This practice fosters a shared understanding of the system architecture and encourages developers, designers, and other stakeholders to contribute to the diagram's improvement. Collaboration ensures that your diagrams stay up-to-date and accurately represent the current state of the system.
Regular Diagram Reviews
Diagrams, like any other documentation, can become outdated or inaccurate over time. Establish a routine for regularly reviewing and validating your diagrams. This process should involve team members who are familiar with the system and can confirm that the visual representations align with the actual implementation. Any discrepancies or needed updates should be addressed promptly to maintain the reliability of your documentation.
Coding Standards for Diagrams
Follow coding standards when creating diagrams as code. Consistent naming conventions, formatting guidelines, and style choices can make your diagram code more readable and maintainable. Aligning with coding standards helps ensure that your diagrams integrate seamlessly with your development workflow.
Best Practices Summary
| Best Practice | Description |
|---|---|
| Simple and Clear Diagrams | Prioritize simplicity and clarity in diagrams |
| Documenting with Comments | Use comments and annotations to explain diagram components and relationships |
| Versioning Diagrams with Architecture | Ensure consistency in versioning between code and diagrams |
| Collaborative Diagramming | Store diagram code alongside project code and encourage collaboration |
| Regular Diagram Reviews | Regularly review and validate diagrams to maintain accuracy |
| Coding Standards for Diagrams | Follow coding standards for diagram code readability and maintainability |
Getting Started with Diagrams as Code
Choosing a DaC Tool
When selecting a tool for diagrams as code, consider the following factors:
| Factor | Description |
|---|---|
| Technical stack alignment | Ensure the tool integrates with your existing development workflow and tech stack. |
| Diagram types | Choose a tool that supports the types of diagrams you need to create. |
| Learning curve | Opt for a tool with a gentle learning curve, especially if you're new to diagrams as code. |
| Community support | Select a tool with an active community, extensive documentation, and reliable support resources. |
| Scalability | Consider a tool that can grow with your project, handling complex diagrams and large datasets. |
Popular tools for diagrams as code include PlantUML, Graphviz, Mermaid, and Draw.io. Research each option to determine which best fits your project's needs.
Learning Basic Syntax
To get started with diagrams as code, you'll need to learn the basic syntax of your chosen tool. Here's a brief primer on the foundational syntax for writing diagrams as code:
- Indentation: Use indentation to define diagram structure and nesting.
- Keywords: Familiarize yourself with tool-specific keywords, such as
node,edge,class, andsequence. - Symbols: Learn the symbols used to represent different diagram elements, such as
->for arrows or[]for nodes. - Comments: Use comments to add context and explanations to your diagram code.
Building Your First Diagram
Creating your first diagram as code can seem daunting, but with a few simple steps, you'll be up and running:
1. Choose a tool: Select a tool that aligns with your project's needs and tech stack.
2. Learn the basics: Familiarize yourself with the tool's syntax, keywords, and symbols.
3. Start simple: Begin with a basic diagram, such as a flowchart or sequence diagram.
4. Experiment and iterate: Refine your diagram as needed, experimenting with different syntax and elements.
5. Integrate with your workflow: Incorporate your diagram into your development workflow, using it to communicate with team members and stakeholders.
Remember, practice is key to mastering diagrams as code. Start small, be patient, and you'll soon be creating complex diagrams with ease.
Integrating Diagrams as Code
Now that we've explored the benefits and building blocks of diagrams as code, it's time to integrate this approach into your workflow. By doing so, you'll experience a significant improvement in the accuracy, consistency, and collaboration of your documentation.
Streamlining Your Workflow
Diagrams as code enable you to automate the process of updating your documentation, ensuring that your diagrams always reflect the latest changes to your system architecture. This automation saves you time and reduces the likelihood of errors.
Enhancing Collaboration
By storing your diagrams as code, you can easily share and collaborate on them with your team members. This facilitates a more open and transparent development process.
Improving Version Control
Diagrams as code can be version-controlled just like your codebase, ensuring that you can track changes and updates to your diagrams over time.
Benefits of Integrating Diagrams as Code
| Benefit | Description |
|---|---|
| Automation | Saves time and reduces errors |
| Collaboration | Facilitates open and transparent development |
| Version Control | Tracks changes and updates to diagrams |
By integrating diagrams as code into your workflow, you'll experience a significant improvement in the accuracy, consistency, and collaboration of your documentation.
FAQs
How to create a diagram as code?
Creating a diagram as code involves writing code in a specific syntax to generate a visual representation of your system architecture or process. Here's a step-by-step guide to get you started:
1. Choose a diagramming language: Select a language that supports diagrams as code, such as PlantUML, Graphviz, or Mermaid.
2. Write your code: Write the code that defines your diagram, including nodes, edges, and relationships.
3. Use a code editor or IDE: Use a code editor or IDE that supports your chosen language to write and edit your code.
4. Generate the diagram: Use a tool or plugin to generate the diagram from your code.
5. Customize and refine: Customize and refine your diagram as needed to ensure it accurately represents your system architecture or process.
Tips for creating diagrams as code:
| Tip | Description |
|---|---|
| Keep it simple | Start with a basic diagram and gradually add complexity. |
| Use comments | Add comments to your code to explain the diagram's components and relationships. |
| Test and iterate | Test your diagram and refine it as needed to ensure accuracy and clarity. |
By following these steps and tips, you can create diagrams as code that are easy to maintain, update, and collaborate on with your team.