
Curated list of top browser extensions for debugging, API testing, accessibility, and AI-powered developer productivity.
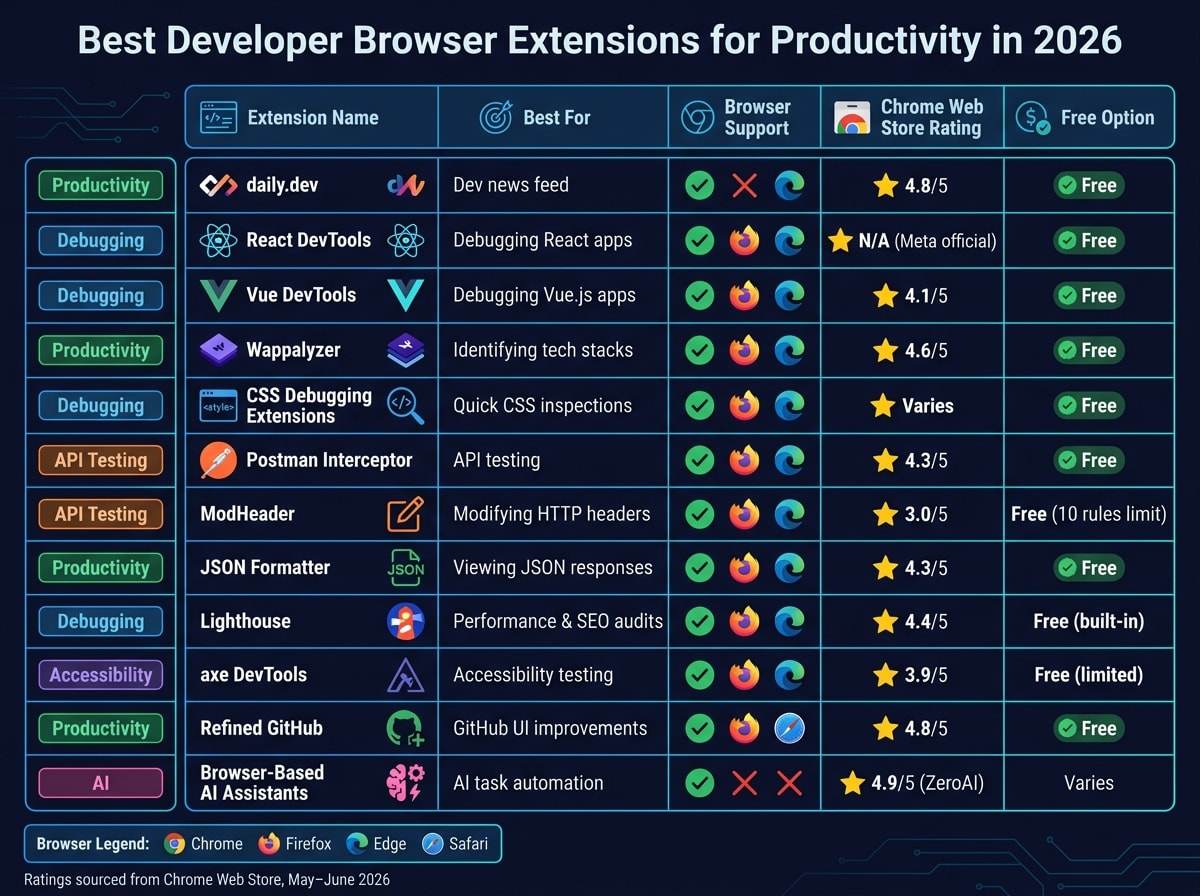
Your browser isn't just for browsing - it's a critical tool for developers. The right extensions can save time, simplify workflows, and boost productivity. Here's a quick look at the best developer browser extensions for 2026:
- daily.dev: A personalized feed of developer news and tutorials on your new tab page. Perfect for staying updated without distractions.
- React DevTools: Debug React apps easily with tools to inspect component trees, states, and props.
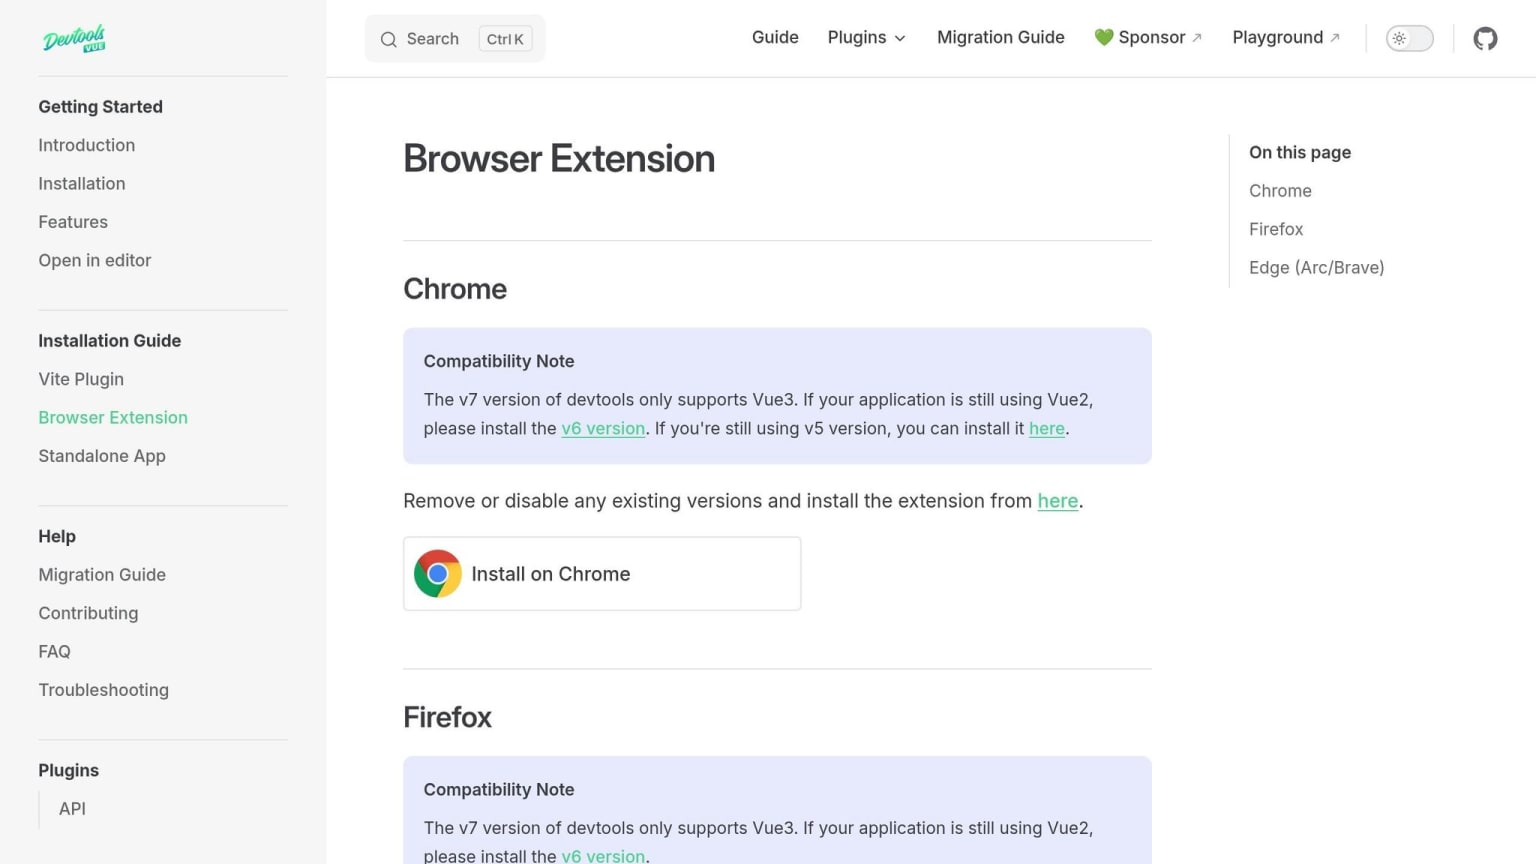
- Vue DevTools: Essential for Vue.js developers, offering real-time debugging of components and state.
- Wappalyzer: Instantly identifies the tech stack behind any website.
- CSS Debugging Extensions: Tools like CSSpeek and DevScope simplify CSS debugging with visual overlays and quick inspections.
- Postman Interceptor: Syncs browser requests with Postman for seamless API testing.
- ModHeader: Modify HTTP headers in real time for testing and debugging.
- JSON Formatter: Makes raw JSON responses readable with a collapsible tree view.
- Lighthouse: Built into Chrome, it audits performance, accessibility, SEO, and more.
- axe DevTools: Accessibility testing to ensure compliance with WCAG standards.
- Refined GitHub: Enhances GitHub's interface with over 200 usability improvements.
- Browser-Based AI Assistants: Tools like Browy and MindTab automate coding, task management, and tab organization.
These tools cover debugging, API testing, accessibility, and even AI-powered assistance, making your browser an extension of your development environment.
Quick Comparison
| Extension | Best For | Browser Support | Free Option |
|---|---|---|---|
| daily.dev | Staying updated on dev news | Chrome, Edge (PWA for others) | Yes |
| React DevTools | Debugging React apps | Chrome, Firefox, Edge | Yes |
| Vue DevTools | Debugging Vue.js apps | Chrome, Firefox, Edge | Yes |
| Wappalyzer | Identifying website tech stacks | Chrome, Firefox, Edge | Yes |
| CSS Debugging Extensions | Quick CSS inspections | Chrome, Edge | Yes |
| Postman Interceptor | API testing with Postman | Chrome, Edge, Firefox | Yes |
| ModHeader | Modifying HTTP headers | Chrome, Firefox, Edge | Yes |
| JSON Formatter | Viewing JSON responses | Chrome, Firefox, Edge | Yes |
| Lighthouse | Performance and SEO audits | Chrome, Edge | Yes |
| axe DevTools | Accessibility testing | Chrome, Edge, Firefox | Yes |
| Refined GitHub | Improving GitHub workflows | Chrome, Firefox, Safari | Yes |
| Browser-Based AI Assistants | Automating tasks with AI | Chrome (limited Firefox) | Varies |
Start with the tools that align with your workflow and browser. Whether you're debugging, testing APIs, or staying informed, these extensions can make your development process smoother and more efficient.
1. daily.dev
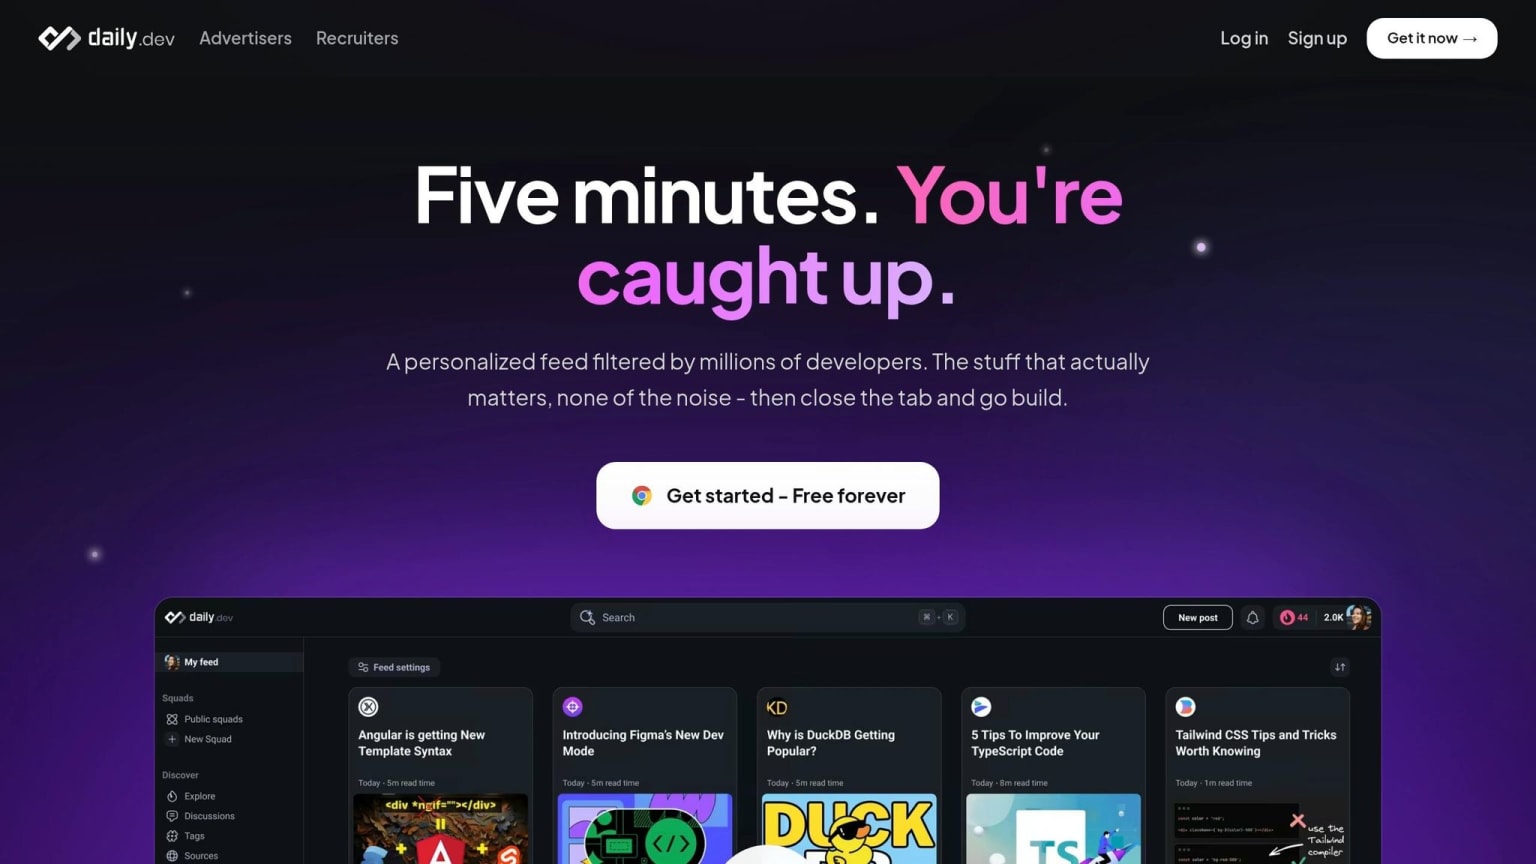
Imagine turning every new browser tab into a chance to learn something new. That’s exactly what daily.dev offers. This browser extension transforms your new tab page into a personalized feed packed with developer articles, tutorials, and discussions. It pulls content from over 2,000 trusted sources, including the GitHub Blog, Hacker News, and freeCodeCamp. No more jumping between websites - this tool brings everything you need directly into your workflow. (Much like how the right VSCode extensions streamline your coding environment.)
Primary Use Case
daily.dev is perfect for staying updated on developer news and technical insights without the hassle of visiting multiple sites. Over time, the feed adapts to your interests and tech stack, making it a smarter, more focused alternative to scattered browsing.
Best For
This tool is ideal for engineers and DevOps professionals who want to keep up with industry trends efficiently. The AI-powered feed learns from your reading patterns, while community input from millions of developers helps highlight the most relevant and high-quality content.
"The more you read, the smarter it gets, because it learns from you and from what over a million other developers find worth reading." - daily.dev
Additionally, you can join Squads, which are communities focused on specific technologies like React, Rust, and AI. These groups help refine your feed even further, ensuring you see content that directly aligns with your work.
Main Advantage
What sets daily.dev apart is its mix of AI-driven personalization and community-backed content curation. Articles aren’t just ranked by algorithms - they're filtered through real developer engagement. Plus, it’s completely free and boasts a 4.8/5 rating on the Chrome Web Store from over 2,800 reviews as of May 2026 .
Potential Drawback
One thing to keep in mind: the extension fully replaces your new tab page. If you prefer a minimalist start page or already use another new tab tool, this might not be for you. Also, Firefox users should note that the dedicated extension is no longer available on the Mozilla Add-ons store as of mid-2026, though a Progressive Web App (PWA) is an alternative .
Browser Support
daily.dev supports Chrome and Microsoft Edge through its extension. For Firefox, Safari, and mobile users, a Progressive Web App (PWA) is available, offering full sync across all your devices .
2. React DevTools
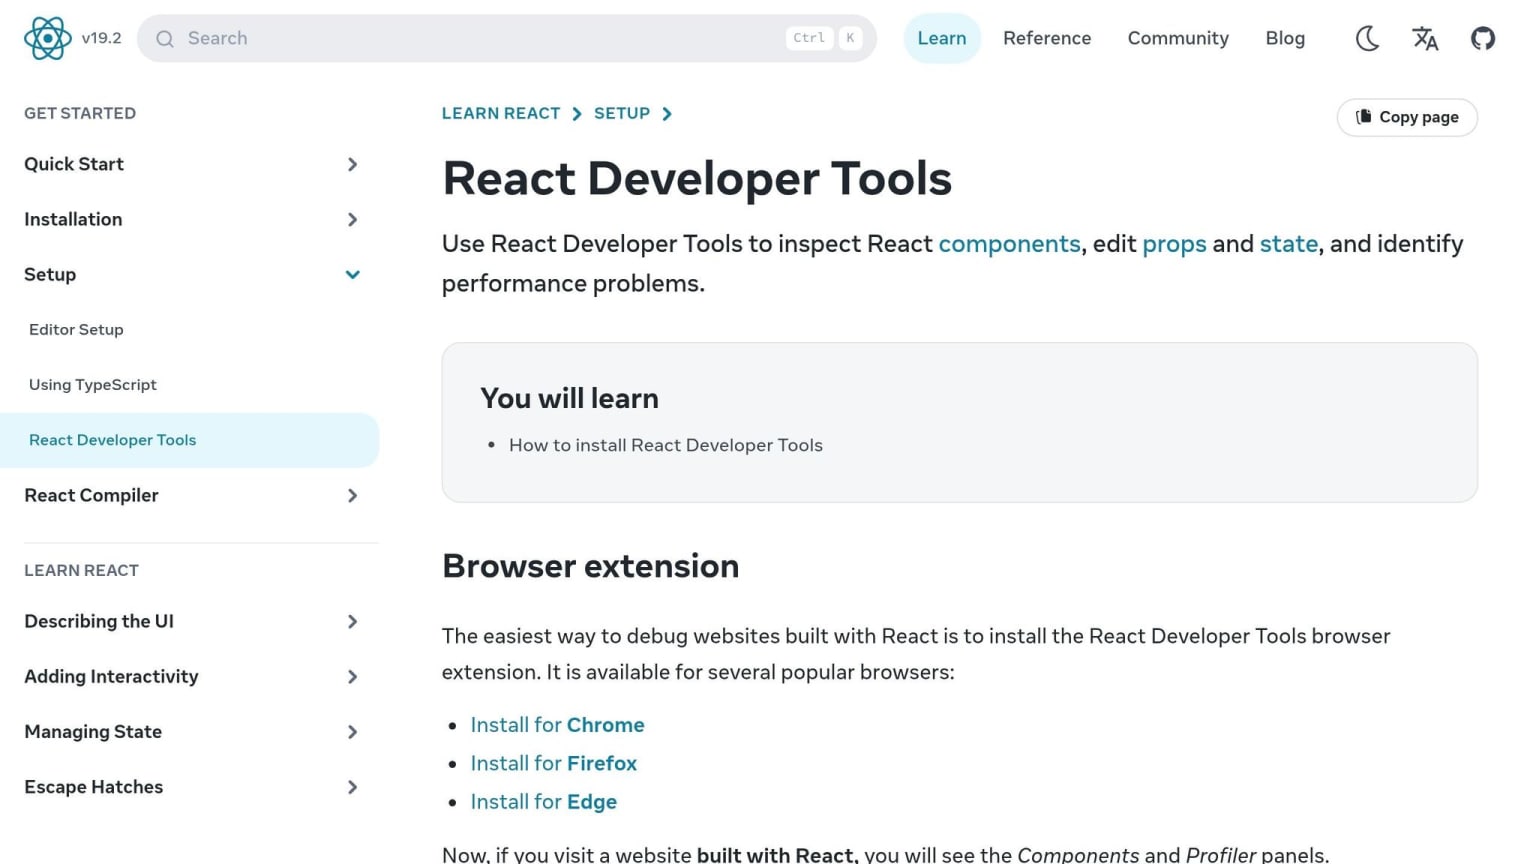
If you're building React applications, React DevTools is a must-have. This official browser extension, developed by Meta, adds two powerful panels - Components and Profiler - to your browser's developer tools. It lets you inspect the entire React component tree and debug your app in real-time, without needing to tweak your source code. Pair this with other productivity tools, and you'll have a smoother, more efficient debugging process.
Primary Use Case
React DevTools is built to help developers inspect and debug React component hierarchies. When you select a component, its props and state are displayed, and you can edit them directly to test alternative behaviors - no source code changes needed. Plus, it integrates seamlessly with the Elements tab: select a DOM node, and the corresponding React component is highlighted instantly.
Best For
This extension is perfect for front-end developers and full-stack engineers working on React or React Native projects. The Profiler tab is especially useful for monitoring rendering performance. It helps you pinpoint unnecessary re-renders and optimize your app's performance before issues make their way to production.
Main Advantage
React DevTools stands out because it's the official debugging tool maintained by the React team at Meta. This ensures compatibility with the latest React features and updates. With millions of downloads from the Chrome Web Store, the tool is highly trusted. A standout feature is the $r global variable: when you select a component in the panel, it becomes accessible in the browser console as $r. This lets you run JavaScript commands directly on that component instance, which can be a game-changer for debugging .
Potential Drawback
There are a few quirks to keep in mind. A known Chrome service worker bug can sometimes prevent the React tab from appearing. The workaround is simple: disable and re-enable the extension via chrome://extensions, then reload the page . Additionally, since the extension has migrated to Manifest V3, you'll need Chrome v102 or newer for it to work properly. Older browser versions may face issues with the Components tab. For debugging in Safari or iframe contexts, you'll need to rely on the standalone react-devtools npm package instead.
Browser Support
React DevTools works on Chrome, Firefox, and Edge. For Safari, React Native apps, or iframes, you can install the standalone version using the following command:
npm install -g react-devtools
3. Vue DevTools
Vue DevTools is a must-have browser extension for developers working with Vue.js. It integrates seamlessly with your browser's developer tools, offering a dedicated panel to explore components, track events, and manage application state.
Primary Use Case
With Vue DevTools, you get a detailed view of every component instance in your app. You can filter components by name, select them directly from the page, and inspect their props, state, and computed properties. Even better, you can edit data values in real time, instantly reflecting changes in the UI. This interactive approach makes debugging Vue applications much smoother.
Best For
This tool is particularly useful for front-end developers working on Vue 3 projects. It works well with state management libraries like Vuex and Pinia, providing a dedicated tab for managing state and supporting time-travel debugging. This makes it easier to trace and resolve issues. Additionally, the event tracking panel simplifies debugging interactions between parent and child components.
Main Advantage
Since Vue DevTools is maintained by the Vue core team, it stays up-to-date with the latest Vue features. Features like the $vm0 shortcut allow you to access a selected component directly in the browser console, letting you execute JavaScript commands on it. The "Open in Editor" button links directly to the component's source file in your IDE, while the "Inspect DOM" button connects to the Elements tab. These features create a direct bridge between your browser and your codebase.
"This tool will be an amazing help when building Vue apps... the panel will let us inspect our Vue application and interact with it." - Flavio Copes, Author of Vue Handbook
Vue DevTools has a 4.1/5 star rating on the Chrome Web Store and launched version 8.1.2 in May 2026 .
Potential Drawback
Although Vue DevTools excels at live debugging, version compatibility can be an issue. Starting with version 7, it supports only Vue 3. For older Vue 2 projects, you'll need the separate v6 "Legacy" version, which has a lower rating due to compatibility problems. Additionally, the extension is disabled by default in production builds for security reasons, so you'll need to enable it manually in your Vue configuration if you want to use it for live debugging.
Browser Support
Vue DevTools is available for Chrome, Firefox, Edge, Brave, and Arc. If you're using Safari or mobile browsers, you can opt for the standalone Electron app:
npm install -g @vue/devtools
This standalone version supports both Vue 2 and Vue 3, making it a versatile option for debugging across different browsers and devices.
4. Wappalyzer
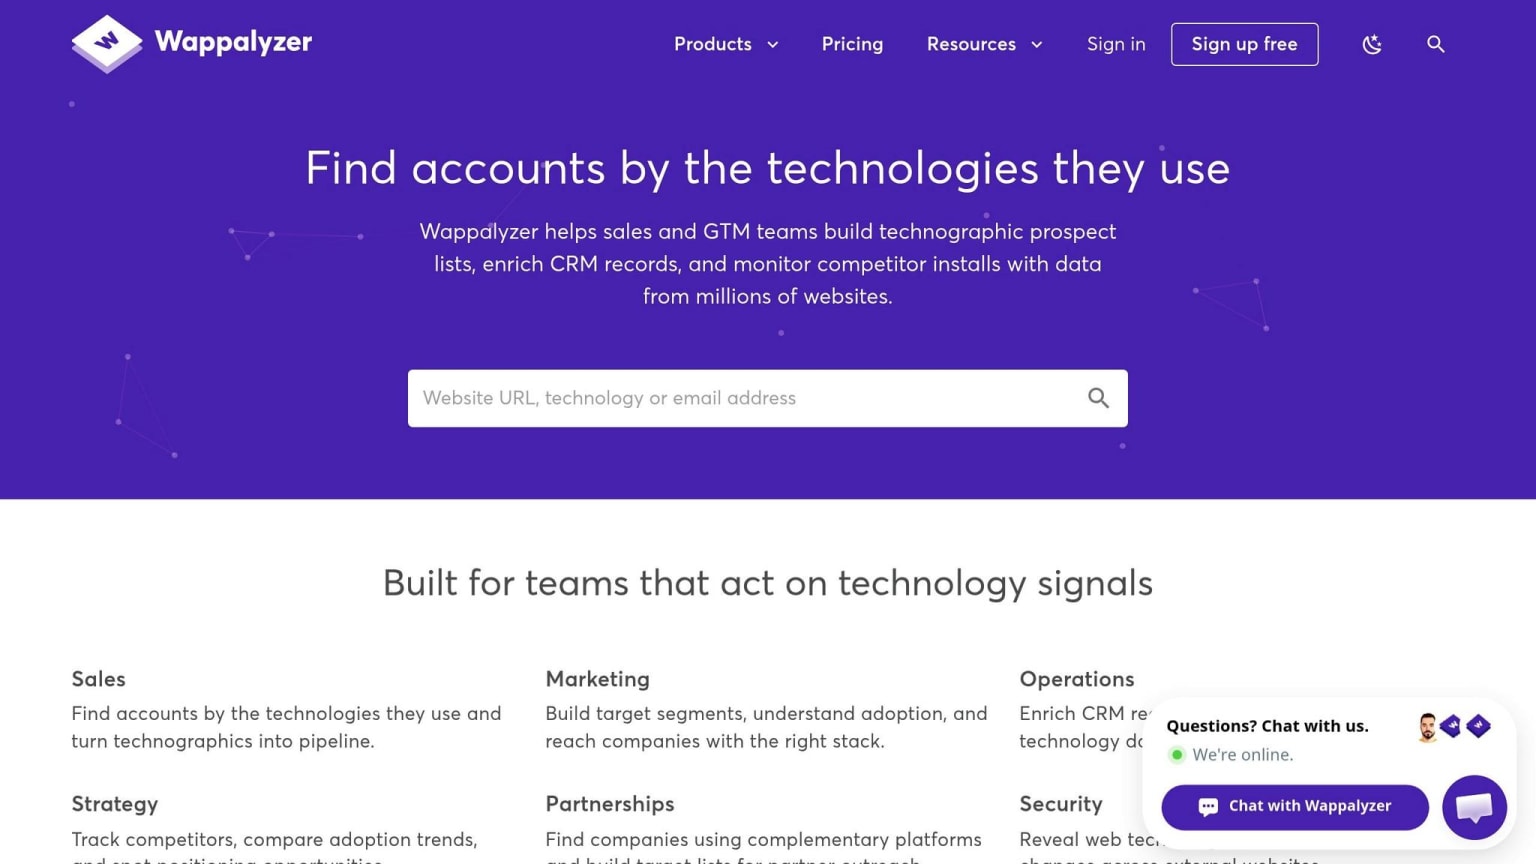
Wappalyzer is a browser extension that gives developers a quick and detailed look at the technologies powering any website. It identifies tools like CMS platforms, JavaScript frameworks, web servers, analytics tools, payment systems, CDNs, and more - spanning over 1,000 technologies across various categories - all in real time from your browser .
Primary Use Case
Wappalyzer works by analyzing key elements of a webpage, such as the HTML source, HTTP headers, cookies, and DOM attributes, to determine how to choose a tech stack or identify the one in use. It assigns a confidence score to each detection, showing how likely the match is correct. For single-page applications, it’s recommended to wait for the page to fully load since certain technologies only appear after JavaScript execution .
Best For
This tool is ideal for developers, marketers, or anyone needing fast insights into a website’s tech stack. It’s especially helpful when taking over a project and needing a snapshot of the production environment. Plus, its ability to export data as a CSV makes it easy to store and analyze findings.
"I use Wappalyzer all the time and it's been invaluable in being relevant in my outreach." - Michael Petselas, Customer Growth Specialist, HubSpot
Main Advantage
Wappalyzer is trusted by millions of users and boasts a 4.6/5 star rating on the Chrome Web Store, backed by thousands of reviews . Beyond the browser extension, its integrations with platforms like Salesforce, HubSpot, and Pipedrive expand its usefulness far beyond basic stack detection.
"Wappalyzer has proven to be a great tool to help us break down the aggregate analysis of how the web is doing by various technologies." - Ilya Grigorik, Principal Engineer, Shopify
Potential Drawback
In May 2023, Wappalyzer shifted its fingerprint database to a closed-source model. This means the free extension may not receive updates as frequently as the paid SaaS version. The enterprise version tracks about 2,700 technologies, compared to just 251 in community-maintained open-source alternatives. Additionally, sites protected by anti-bot measures like Cloudflare can occasionally block detections . These limitations highlight the importance of weighing features against your specific needs.
Browser Support
Wappalyzer supports Chrome, Firefox, Edge, and Safari, and even offers iOS functionality for mobile users. While the browser extension is free, API access for higher usage levels starts at $250 per month for 500 lookups .
5. CSS Debugging Extensions
CSS debugging extensions are a handy addition to any developer's toolkit. They simplify the process of inspecting styles without diving deep into the often overwhelming DevTools. While DevTools are undeniably powerful, sometimes you just need a quick way to figure out why a div is out of place or why a font isn't displaying correctly.
Primary Use Case
These extensions are designed to help developers quickly inspect computed styles, analyze layout structures, and pinpoint CSS conflicts. For example:
- CSSpeek focuses on the essentials, displaying the top ten CSS properties - like selectors, box models, typography, and colors - in a streamlined panel. It covers about 95% of common CSS queries.
- DevScope digs deeper, identifying specificity conflicts and unused CSS rules. Plus, it operates offline and doesn't track your activity, making it a privacy-friendly option.
- DevSuite Pro offers a suite of tools, including visual overlays for CSS Grid and Flexbox layouts, a Z-Index Inspector, and an Animation Inspector. It even includes over 64 developer tools to tackle more advanced needs.
These tools are designed to address CSS-specific issues, making them a great complement to the broader capabilities of DevTools.
Best For
Each extension has its strengths, depending on what you're looking for:
- CSSpeek: Ideal for quick, no-fuss inspections. It's completely free and requires zero setup.
- DevSuite Pro: Perfect for utility-first CSS workflows, with features like "Copy as Tailwind" that instantly convert CSS into Tailwind classes.
- DevScope: Great for thorough audits, especially since it works offline and avoids tracking.
- React Inspector Pro: A fantastic choice for React developers, as it filters out framework layers to focus on the actual components' CSS.
Main Advantage
One of the biggest perks of these extensions is how they speed up debugging. They display rendered values directly on the page, saving you from navigating through multiple DevTools panels. For instance, in March 2026, Sai Krishna Kanteti released React Inspector Pro v2.7.0, which introduced a "Smart Library Filtering" feature. This automatically skips over layers of framework wrappers, allowing developers to quickly locate the components they need.
Potential Drawback
There are some limitations to consider. These tools might not work on high-security sites with strict content security policies, and they can't inspect cross-origin iframes due to browser security rules. Additionally, any live edits you make with these tools are temporary and will disappear once the page is refreshed.
Browser Support
| Extension | Browser Support | Pricing |
|---|---|---|
| CSSpeek | Chrome, Edge, Brave, Arc | Free |
| DevScope | Firefox, Chrome, Edge | Free |
| DevSuite Pro | Chrome, Firefox, Edge | Free / $2.99/month or $29.99 one-time |
| React Inspector Pro | Chrome, Edge | Free (open source, MIT License) |
6. Postman Interceptor
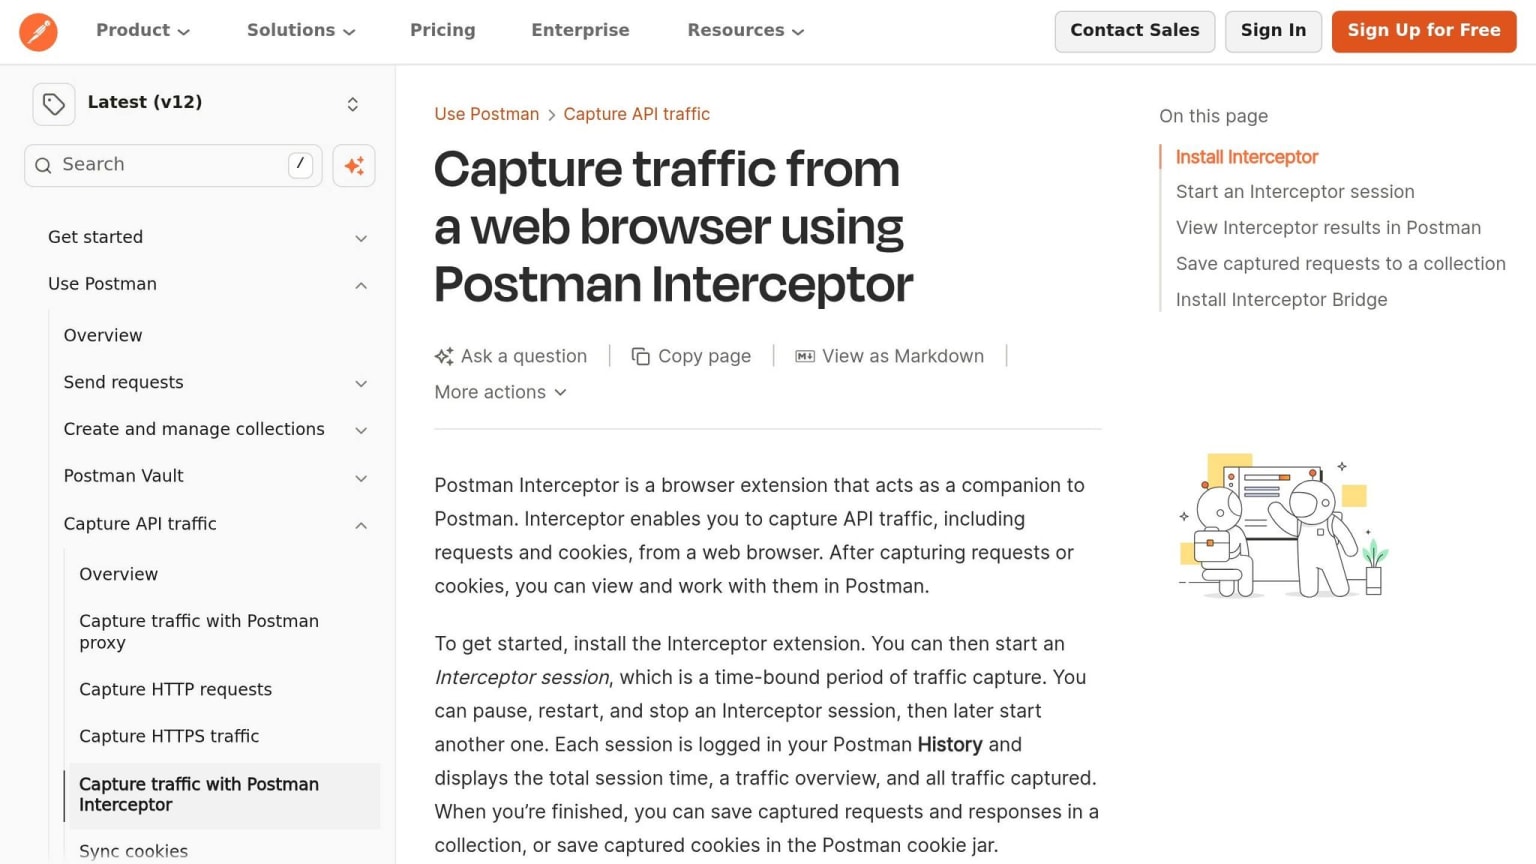
Simplify testing authenticated API endpoints - Postman Interceptor captures live requests, including cookies and headers, and forwards them to Postman, saving you from manual copying.
Primary Use Case
Postman Interceptor works as a connection between your browser and Postman, capturing requests and cookies in real-time. These are sent to Postman's History tab, where you can inspect, replay, or convert them into Collections. According to Postman Inc.:
"Something that would have required a proxy earlier can now be achieved without any installation steps or extra configuration."
Best For
This tool is perfect for testing and analyzing web APIs using RESTful API design best practices, especially endpoints that rely on browser-based authentication. It also helps document traffic quickly by turning captured requests into organized Postman Collections. The cookie synchronization feature ensures your active browser cookies are automatically synced to Postman's cookie jar, allowing seamless testing of authenticated requests without re-entering credentials.
Main Advantage
Postman Interceptor overcomes browser restrictions on certain headers, giving you complete control over requests. You can even filter captured traffic by HTTP method or domain using regex. With a 4.3/5 rating from 951 reviewers on the Chrome Web Store and over 800,000 users, it’s a popular choice for developers .
Potential Drawback
The extension requires the Postman desktop app to be running on the same machine to function. Linux users face an additional step - they need to install an "Interceptor Bridge" to enable communication between the browser and desktop client. This step isn’t necessary for Windows and macOS users running newer Postman versions (v10.18+ and v10.17.4+, respectively) . Another limitation is that only one Interceptor or proxy session can run at a time, which might be restrictive for those managing multiple environments.
Browser Support
| Browser | Supported |
|---|---|
| Google Chrome | ✅ Yes |
| Mozilla Firefox | ✅ Yes |
| Microsoft Edge | ✅ Yes |
| Apple Safari | ✅ Yes |
7. ModHeader
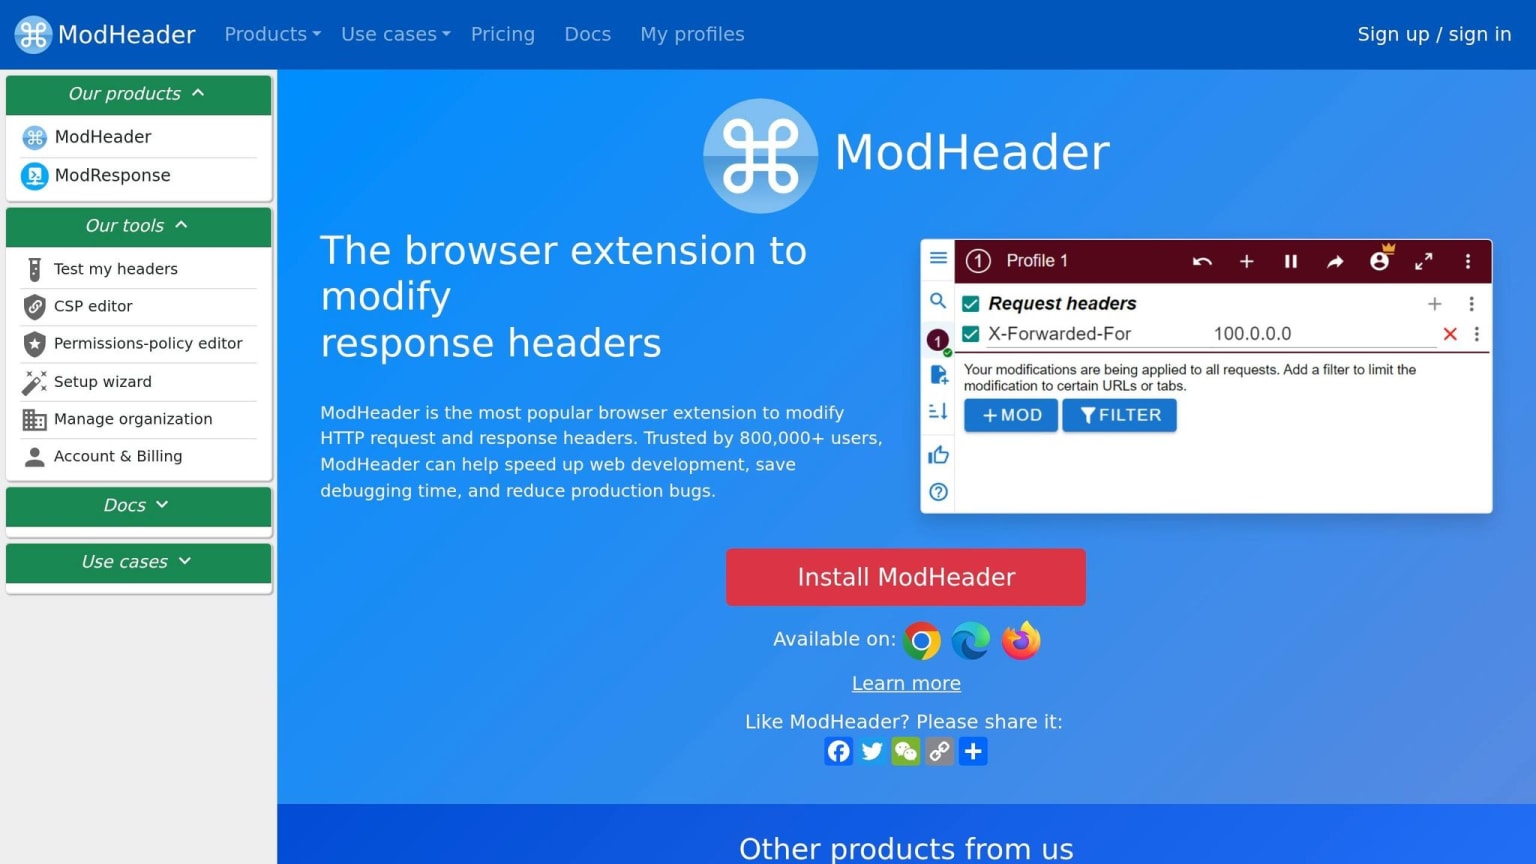
ModHeader is a browser extension that allows you to add, change, or remove HTTP request and response headers without needing a proxy setup or code changes. It's especially handy for tasks like injecting an Authorization header, testing CORS behavior, or simulating requests from a different IP address using X-Forwarded-For.
Primary Use Case
ModHeader streamlines testing by intercepting browser requests in real time and applying custom header rules before they leave your device. This makes it an excellent tool for authentication testing, where you might need to insert Bearer tokens or API keys to access protected endpoints without altering your application’s code. It also supports URL redirection, enabling you to quickly redirect your front end to a local or staging API instead of production, all with a simple rule toggle.
Best For
This extension is ideal for API developers and QA engineers who frequently switch between different testing environments. Its profile system allows you to save separate header configurations - complete with dynamic variables like {{uuid}} and {{timestamp}} - for development, staging, and production. Switching between profiles is as easy as a single click .
Main Advantage
The tool's simplicity and adaptability stand out. You can toggle header rules with just a click or two, and its URL, tab, or window filters ensure that changes only apply to specific tabs you’re testing, leaving other sites unaffected. For teams, ModHeader lets you export rule configurations as JSON files, making it easy to share setups and maintain consistency during testing .
Potential Drawback
ModHeader's Chrome Web Store rating is 3.0/5 from over 1,200 reviews as of June 2026. A common complaint is that features once free are now behind a paywall. The free plan allows only 10 active rules, which can be restrictive for more complex projects. Additionally, the extension requires broad permissions, like webRequest and access to <all_urls>, raising concerns in security-conscious settings. The shift to Manifest V3 for Chromium-based browsers has also limited some advanced cookie modification features, making them less effective compared to older versions .
Browser Support
ModHeader works across all major browsers:
| Browser | Supported |
|---|---|
| Google Chrome | ✅ Yes |
| Mozilla Firefox | ✅ Yes |
| Microsoft Edge | ✅ Yes |
| Opera | ✅ Yes |
8. JSON Formatter
JSON Formatter transforms raw JSON responses into a clean, indented, syntax-highlighted tree view - eliminating the need to copy and paste into external tools.
Primary Use Case
This tool intercepts JSON and JSONP responses as they load, displaying them in a structured, collapsible tree format. It’s perfect for tasks like testing API endpoints, reviewing webhook payloads, or analyzing responses from third-party APIs. Features like clickable URLs and keyboard shortcuts (e.g., P for a parsed view and R for a raw view) make it a breeze to use .
Best For
Backend and full-stack developers will find this extension especially useful for inspecting API responses directly in their browser. It's also a great tool for anyone debugging integrations or navigating through large, nested JSON payloads without needing a dedicated API client.
Main Advantage
Created by Callum Locke, JSON Formatter boasts a 4.3/5 star rating with millions of users and thousands of reviews on the Chrome Web Store . Its lightweight design ensures minimal impact on non-JSON pages - less than 1 millisecond. Advanced versions offer additional features like JSONPath and jq-style query support, side-by-side JSON diffing, and the ability to convert JSON into YAML, XML, or CSV . It also handles BigInt precision correctly, ensuring large integers are displayed accurately without truncation .
Potential Drawback
One notable issue is with Firefox compatibility. Since Firefox has a built-in JSON viewer enabled by default, you’ll need to disable it via about:config (set devtools.jsonview.enabled to false) to use third-party formatters . On Chrome and Edge, you might also need to enable "Allow access to file URLs" in the extension settings for local JSON files. Additionally, conflicts with other DOM-modifying extensions can occasionally cause silent failures, so it’s worth checking for compatibility issues after browser updates .
Browser Support
| Browser | Supported |
|---|---|
| Google Chrome | Yes |
| Mozilla Firefox | Yes (requires config change) |
| Microsoft Edge | Yes |
| Brave | Yes |
| Opera | Yes |
| Arc | Yes |
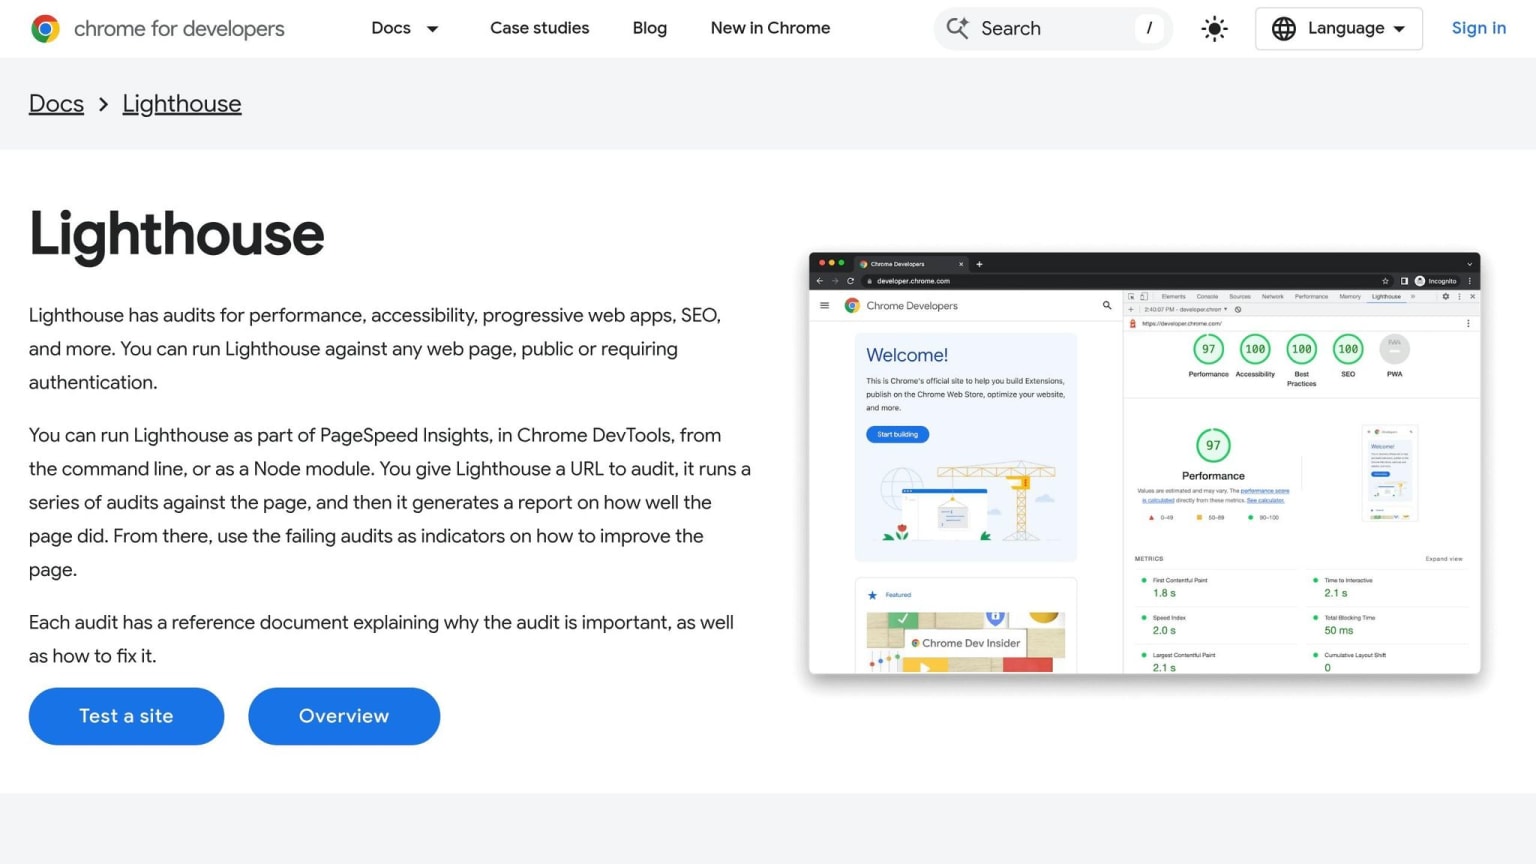
9. Lighthouse
Primary Use Case
Lighthouse is an open-source auditing tool from Google, integrated directly into Chrome DevTools. It's designed to evaluate web pages, running a series of tests to generate a scored report in four key categories: Performance, Accessibility, Best Practices, and SEO . Each failed audit comes with a helpful reference link that explains the issue and provides guidance on how to fix it . Lighthouse offers three modes: Navigation (for fresh page loads), Timespan (to track multiple user interactions), and Snapshot (to audit the current state of a page). These modes make it versatile for identifying problems at different points in the user journey .
Best For
Lighthouse is perfect for developers who need a quick, detailed health check of a webpage. It's especially effective at diagnosing Core Web Vitals issues like Largest Contentful Paint (LCP), Cumulative Layout Shift (CLS), and Total Blocking Time (TBT) - all of which are critical for user experience and search rankings . For example, the "Largest Contentful Paint element" audit pinpoints the specific UI element that's slowing down perceived load times .
Main Advantage
The tool's unified scoring system (on a scale of 0–100) gives a clear snapshot of overall page health. The Performance score, in particular, is a weighted average where metrics like LCP and TBT each contribute 25%, highlighting the importance of both speed and interactivity .
"Lighthouse is an open-source, automated tool for improving the performance, quality, and correctness of your web apps." - Google Ireland, Ltd.
Lighthouse is trusted by a massive developer community, with over 1,000,000 users on the Chrome Web Store, a 4.4/5 star rating from 333 reviews, and more than 30,300 stars on GitHub . Its auditing engine is also used by third-party tools like WebPageTest, Calibre, and DebugBear, making it a staple in professional monitoring platforms .
Potential Drawback
One common complaint about Lighthouse is the inconsistency of its scores. Results can fluctuate between runs due to factors like local CPU usage, background processes, or other browser extensions . To minimize variability, running Lighthouse in an incognito window with the "Clear storage" option enabled can help . For more in-depth performance debugging - such as analyzing specific JavaScript execution - the Chrome DevTools Performance panel is often a better option. As Barry Pollard from the Chrome DevTools team explains:
"We recommend the Performance panel for performance debugging... but Lighthouse is still useful for the other categories (Accessibility, Best Practices, SEO)."
This makes Lighthouse a great complement to other debugging and accessibility tools.
Browser Support
| Browser | Supported |
|---|---|
| Google Chrome | Yes (built into DevTools) |
| Microsoft Edge | Yes (built into DevTools) |
| Brave | Yes (via extension) |
| Mozilla Firefox | Yes (via Node CLI or extension) |
| Safari | No native support |
10. axe DevTools
Primary Use Case
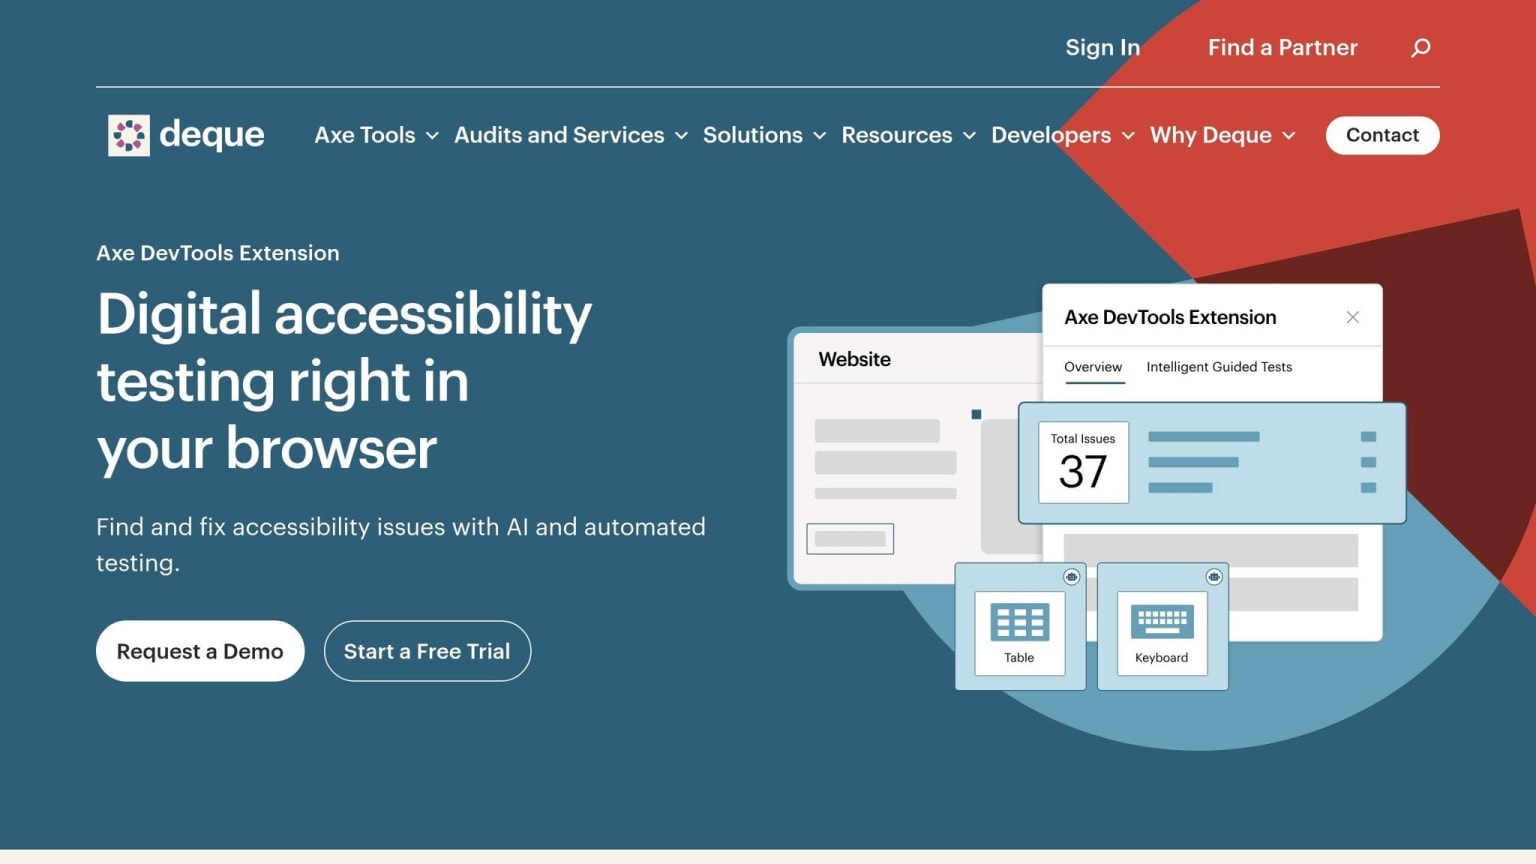
axe DevTools, created by Deque Systems, is an accessibility testing extension that integrates directly into your browser's developer tools. It uses the axe-core engine, which has been downloaded over 3 billion times globally . This tool checks web pages for accessibility issues based on WCAG 2.0, 2.1, and 2.2 standards (Levels A, AA, and AAA), as well as Section 508 and EN 301 549, ensuring it meets a range of compliance requirements .
Best For
This tool is perfect for developers aiming to identify and resolve accessibility problems early in the development process, before they escalate into costly fixes. The free version provides automated scans for individual pages, flagging issues like missing alt attributes, poor color contrast, and improper ARIA roles. For those requiring deeper insights, the Pro version includes Intelligent Guided Testing (IGT), an AI-powered tools feature that reveals complex issues, such as inaccessible modals or broken keyboard navigation, which automated scans often overlook .
Main Advantage
One standout feature of axe DevTools is its zero false positives guarantee for automated scans . Each flagged issue comes with detailed remediation guidance, including the element's source code, a CSS selector, and a link to relevant documentation . This makes it accessible even to developers without extensive accessibility knowledge.
"The Axe DevTools Extension is an automated accessibility testing tool that helps you find and fix accessibility issues early in web development right in your Chrome browser." - Deque Systems
With hundreds of thousands of installations on the Chrome Web Store and a 3.9/5 star rating, this extension is a trusted resource among developers .
Potential Drawback
The free version has its limitations - it only supports automated testing for single pages. Features like saving results, exporting data, component-level testing, and Intelligent Guided Testing are reserved for the Pro subscription . Teams looking to test multi-step workflows or integrate accessibility checks into CI/CD pipelines will need to invest in Pro or enterprise plans. However, for basic accessibility checks, the free version still provides significant value.
Browser Support
| Browser | Supported |
|---|---|
| Google Chrome | Yes (full support) |
| Microsoft Edge | Yes (full support) |
| Mozilla Firefox | Yes (Pro features unavailable) |
11. Refined GitHub

Primary Use Case
Refined GitHub is an open-source browser extension designed to enhance the GitHub interface with over 200 improvements. These include features like one-click review approvals, visible whitespace in code, and handy keyboard shortcuts . It’s all about creating a smoother and more efficient workflow for GitHub users.
Best For
This extension is ideal for developers who use GitHub extensively, particularly for tasks like code reviews and managing issues. With Refined GitHub, you can mark multiple files as "Viewed" using a shift-click, jump straight to the first unreviewed file in a pull request, and easily identify pull requests with merge conflicts . By simplifying these everyday tasks, it helps developers save time and work more effectively.
Main Advantage
Refined GitHub offers several practical upgrades to the platform. It reduces the default tab size in code views from 8 to 4 spaces, automatically resizes comment fields, and displays reaction avatars so you can instantly see who reacted to a comment. Plus, it introduces useful keyboard shortcuts like "g r" to navigate to releases and "d w" to toggle whitespace visibility in diffs . The extension has earned a 4.8/5-star rating on the Chrome Web Store, based on 265 user reviews .
Potential Drawback
The developers describe Refined GitHub as "highly opinionated" , meaning some of its changes might not suit everyone’s preferences or workflows. Fortunately, most JavaScript-based features can be turned off in the extension settings. However, Firefox users should note that the auto-resizing comment fields feature (fit-textareas) was discontinued in April 2026 .
Browser Support
| Browser | Supported | Notes |
|---|---|---|
| Google Chrome / Chromium | Yes | Full feature support |
| Mozilla Firefox (Desktop & Android) | Yes | fit-textareas feature removed as of April 2026 |
| Safari (macOS, iOS, iPadOS) | Yes | Available as a Safari Extension app |
12. Browser-Based AI Assistants
Primary Use Case
AI-powered browser extensions have become indispensable for streamlining workflows. These tools can handle tasks like summarizing documents, analyzing code, automating schedules, and managing tabs. For example, Browy uses the GitHub Copilot SDK to control logged-in tabs through chat or a DevTools CLI. It can handle tasks such as PR reviews and form filling by interpreting the browser's accessibility tree . Meanwhile, DevMentorAI focuses on providing expert guidance for AWS, Kubernetes, and CI/CD pipelines - all accessible directly within the browser .
Best For
These extensions are particularly helpful for developers juggling multiple tasks like research, communication, and coding. They pair well with other productivity tools, making multitasking more efficient. ZeroAI, for instance, extracts tasks from platforms like Slack and Jira, then schedules "Deep Work" sessions on Google Calendar. It boasts a 4.9/5 rating from 65 users on the Chrome Web Store . On the other hand, MindTab is a great choice for those working with sensitive data. It uses on-device Gemini Nano to organize tabs and summarize content without sending any information to external servers .
Main Advantage
The standout feature in 2026 is the rise of agentic browsing - extensions that don't just provide answers but actively perform tasks. For example, DOMShell converts the browser's accessibility tree into a virtual filesystem, allowing AI agents like Claude or GPT to navigate pages using Linux-like shell commands . Similarly, daily.dev's Ask feature scans hundreds of technical articles daily, surfacing the most relevant insights for your tech stack . MindTab further enhances productivity by grouping over 100 tabs in milliseconds using zero-latency local processing .
Potential Drawback
The trade-off with these advanced tools often comes down to setup complexity versus functionality. High-powered extensions require more effort to configure. For instance, Browy needs a local Node.js backend , while DOMShell relies on a Node.js server and a WebSocket bridge . MindTab's Gemini Nano integration demands Chrome Canary with experimental AI flags enabled . While simpler tools are easier to install, they typically lack the depth and capabilities of these more robust options.
Browser Support
| Extension | Browser Support | Notable Requirement |
|---|---|---|
| Browy | Chrome / Chromium | GitHub Copilot subscription + Node.js native host |
| DevMentorAI | Chrome / Chromium | Copilot CLI + local Docker backend |
| ZeroAI | Chrome | Extension only; no local server needed |
| MindTab | Chrome Canary | Experimental AI flags must be enabled manually |
| DOMShell | Chrome (Side Panel) | Local Node.js server + WebSocket bridge |
Pros and Cons Comparison
When deciding which browser extension to install, it's essential to weigh their strengths, limitations, and compatibility with your preferred browser. Here's a side-by-side breakdown of 12 popular extensions, covering their standout features, potential downsides, and support for Chrome and Firefox.
| Extension | Primary Strength | Key Drawback | Chrome | Firefox |
|---|---|---|---|---|
| daily.dev | AI-curated dev news feed with community features and a 4.8/5 rating | Replaces the new tab page; no Firefox extension | ✅ | ❌ (PWA available) |
| React DevTools | Detailed inspection of component trees, state, and props | Can slow down complex apps | ✅ | ✅ |
| Vue DevTools | Real-time debugging for Vue components and Vuex state | Limited to Vue projects | ✅ | ✅ |
| Wappalyzer | Quickly identifies tech stacks on websites | - | ✅ | ✅ |
| CSS Debugging Extensions | Visual CSS editing with point-and-click functionality; 4.8/5 rating | - | ✅ | ❌ |
| Postman Interceptor | Syncs browser requests with the Postman app | Requires Postman desktop app | ✅ | ❌ |
| ModHeader | Modify HTTP request/response headers in real time | - | ✅ | ✅ |
| JSON Formatter | Converts raw API responses into readable trees; 4.3/5 rating | - | ✅ | ✅ |
| Lighthouse | Audits performance, SEO, and PWA metrics | - | ✅ | ❌ (built into Chrome) |
| axe DevTools | Automated accessibility audits based on WCAG standards | Manual checks still required for full compliance | ✅ | ✅ |
| Refined GitHub | Enhances GitHub's UI with better usability features | - | ✅ | ✅ |
| Browser-Based AI Assistants | Offers automated coding guidance and task management | Privacy concerns and occasional inaccuracies | ✅ | Limited |
A few trends emerge from this comparison. Debugging tools like React DevTools, Vue DevTools, and axe DevTools provide consistent cross-browser functionality, making them versatile choices for developers regardless of their browser preference. On the other hand, workflow-oriented tools such as Postman Interceptor lean heavily toward Chrome, leaving Firefox users with fewer options.
Among these, daily.dev is unique because it integrates seamlessly into a developer's daily routine rather than being a situational tool. Its AI-powered feed, free features, and 4.8/5 Chrome Web Store rating make it an appealing choice for staying updated, especially since it doesn’t track your browsing history or alter other pages. Firefox users can access similar functionality through its PWA version.
Lastly, consider the performance impact of these tools. Extensions like React DevTools and browser-based AI assistants can slow down complex pages, while lightweight options like JSON Formatter, ModHeader, and Refined GitHub are easier on system resources. To optimize your workflow, enable only the tools you use frequently. For more ways to streamline your output, check out these performance boosting tips.
Conclusion
Pick browser extensions that address your specific workflow needs.
Out of the many tools available, daily.dev is a standout choice. If staying updated on industry trends is a priority, this extension is a great place to begin. It turns your new tab into a custom feed powered by community insights and AI, bringing you the most relevant developer news. As described by daily.dev:
"Think of it as a feed curated by a senior engineer who shares your exact interests"
The best part? It’s free, lightweight, and only changes your new tab.
For frontend developers, tools like React DevTools or Vue DevTools, combined with axe DevTools or Lighthouse, offer excellent debugging and quality assurance capabilities. If your work revolves around APIs, ModHeader and JSON Formatter can make your tasks more efficient. And for those relying heavily on GitHub, Refined GitHub brings impactful improvements to your workflow.
FAQs
Which extensions should I install first?
daily.dev is a great way to boost your professional development. It turns your new browser tab into a personalized feed of tech content, pulling from reliable sources to keep you informed without extra effort. With millions of developers using it, you’ll find articles, tutorials, and discussions aligned with your interests. Plus, it’s open source, privacy-focused, and encourages community-driven learning.
Will these extensions slow down my browser?
Browser extensions can help you get more done, but they can also impact your browser's performance based on how they're built and how many resources they use. If you want to keep things running smoothly, go for lightweight options like daily.dev. This tool simply replaces your new tab page without tracking your activity, altering other sites, or injecting scripts. And if you decide it’s not for you, removing it takes just a few seconds.
How do I choose the right extensions for my browser?
Select browser extensions that align with your specific workflow needs - whether that's debugging code or keeping up with industry news. Always double-check that these tools only ask for permissions they genuinely need and don’t track your browsing habits. Prioritize extensions from trustworthy sources, and whenever possible, go for open-source options to ensure transparency. To keep your browser running smoothly, stick to a minimal number of extensions and install only the ones you truly need.