

Explore the top Python profiling tools to enhance code performance, identify bottlenecks, and optimize memory usage effectively.
Want to make your Python code faster and more efficient? Profiling tools help you identify bottlenecks, memory leaks, and performance issues. Here are the top 7 Python profiling tools to optimize your code:
- cProfile: Built-in tool for function-level stats. Great for general profiling.
- line_profiler: Analyzes code line-by-line to find specific bottlenecks.
- memory_profiler: Tracks memory usage and detects leaks.
- py-spy: Low-overhead CPU profiler, ideal for production use.
- Pyinstrument: Visualizes call stacks for detailed function tracking.
- Scalene: Combines CPU and memory profiling for a complete analysis.
- Intel Tiber: Real-time production profiler with multi-language support.
Quick Comparison
| Tool | Use Case | Strengths | Overhead |
|---|---|---|---|
| cProfile | General profiling | Built-in, no setup required | Moderate |
| line_profiler | Line-level analysis | Pinpoints slow lines | Moderate |
| memory_profiler | Memory tracking | Detects leaks, tracks allocation | Moderate |
| py-spy | CPU profiling in production | Low impact, real-time insights | Minimal |
| Pyinstrument | Call stack visualization | Interactive reports, sampling mode | Minimal |
| Scalene | CPU and memory profiling | Multi-threaded, memory insights | Low |
| Intel Tiber | Live production monitoring | Real-time, multi-language support | Low |
Start with cProfile for a general overview, then use tools like line_profiler for deeper analysis or py-spy for live applications. Tailor your choice to your specific needs to ensure optimal performance.
Beyond cProfile: Performance Optimization with Sampling Profilers and Logging
1. cProfile: Built-in Performance Analyzer
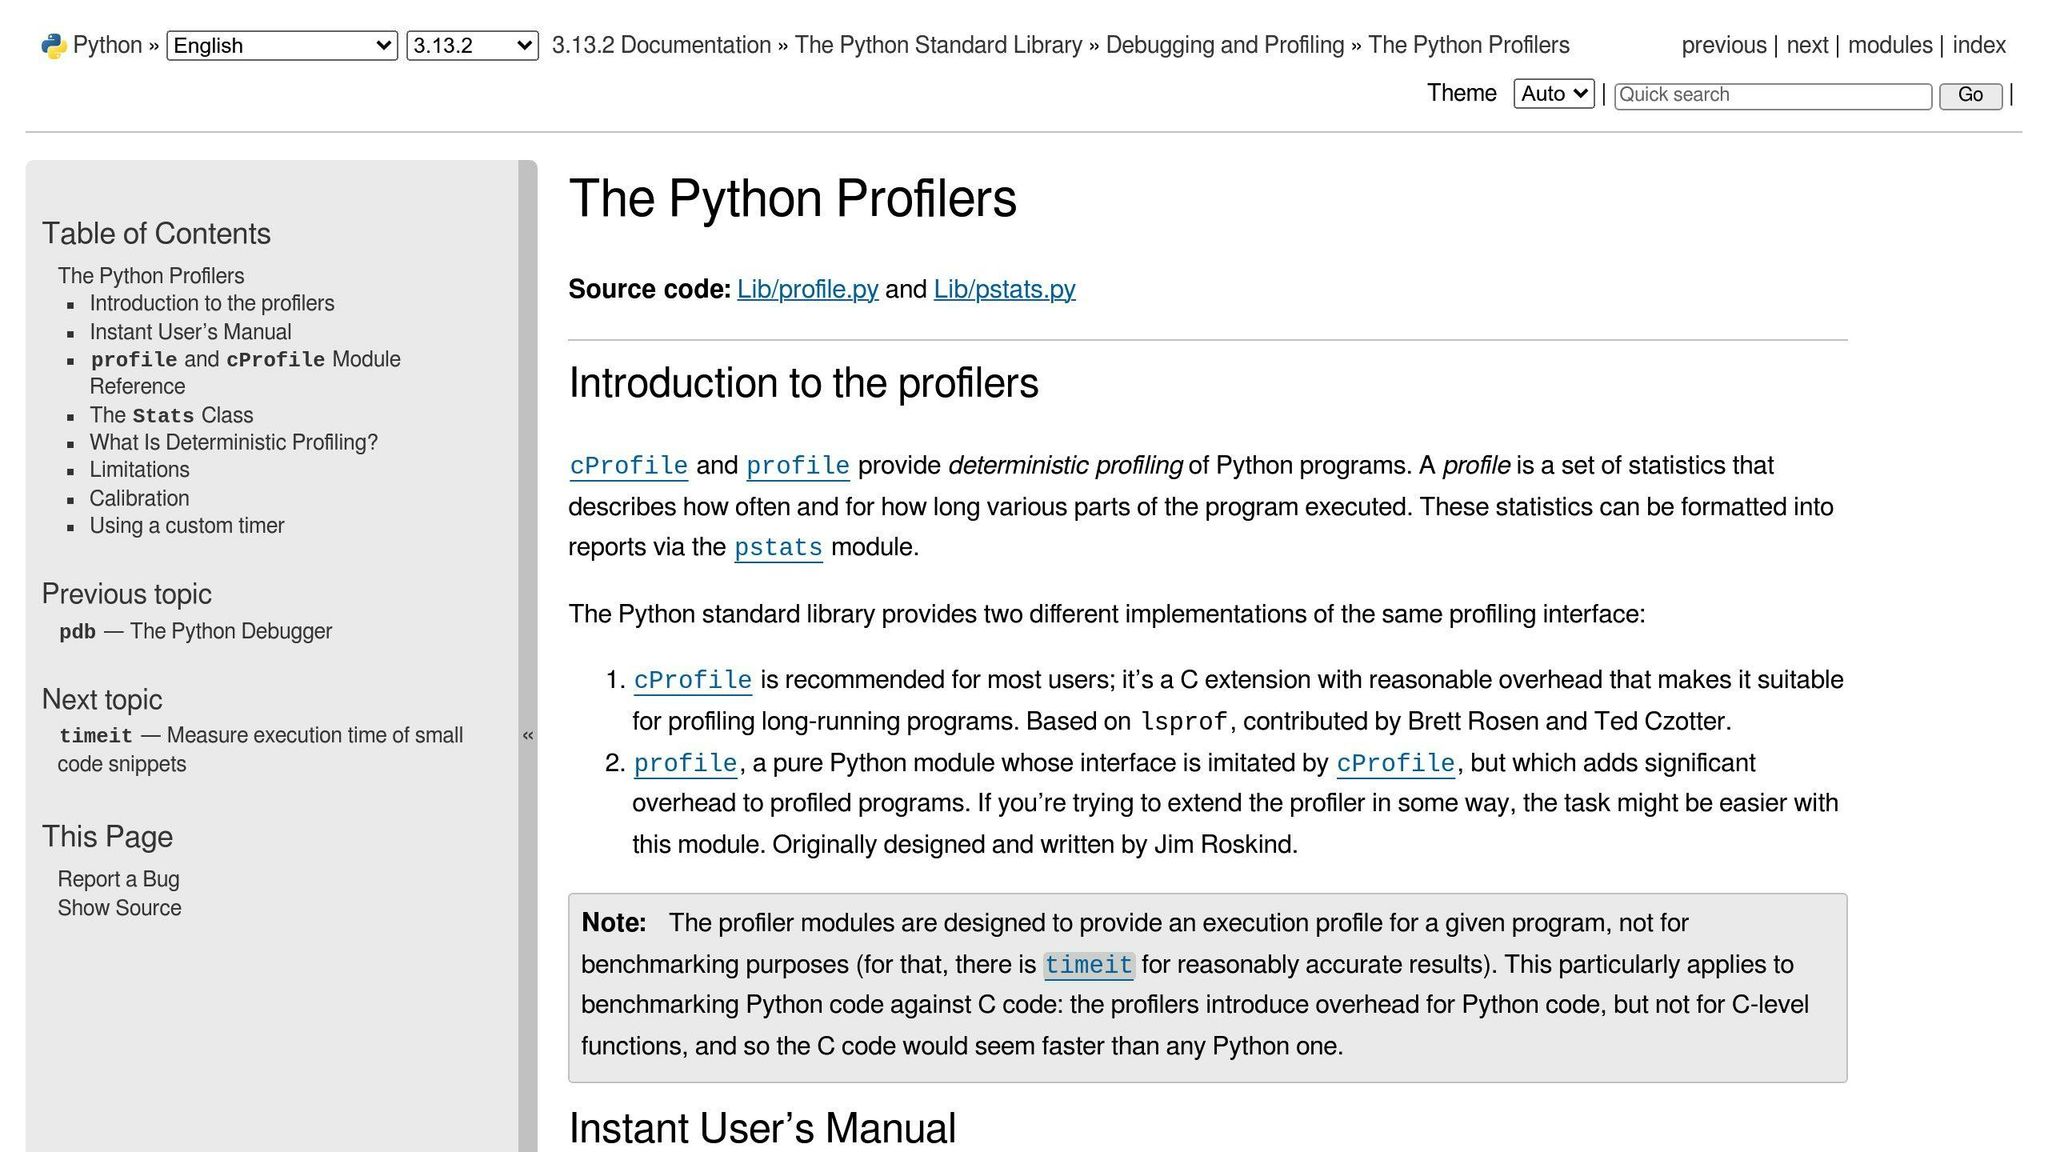
cProfile is Python's built-in tool for analyzing performance. It lets developers measure how long functions take to execute and how often they're called, all without needing to install extra packages. Since it's part of Python's standard library, it's an easy and accessible option for performance analysis.
With cProfile, you get detailed stats like total execution time, the number of function calls, and the time spent per call. To use it, just run your script with this command:
python -m cProfile myscript.py
This generates a report that highlights performance bottlenecks. For example, you might discover that a sorting function is being called too often and takes up a large chunk of execution time - making it a prime candidate for optimization .
Why cProfile stands out:
- No Setup Required: It's built into Python, so there's no need for additional installation.
- Detailed Metrics: Offers in-depth stats on function calls and execution times.
However, keep in mind that cProfile can add some performance overhead. If you're profiling in a production environment, tools like py-spy might be a better choice since they have less impact on performance .
To get the most out of cProfile:
- Start Early: Use it during development to catch performance issues before they escalate .
- Sort Results: Organizing output by metrics like execution time makes it easier to spot areas that need improvement, especially in large codebases.
You can also integrate cProfile into CI pipelines to track performance trends and catch regressions early .
While cProfile is a great starting point, you might want to explore tools like line_profiler for more specific, detailed insights.
2. line_profiler: Code Analysis Line by Line
line_profiler is a tool designed to analyze code performance line by line, helping you identify specific bottlenecks. It’s especially useful when you need to dig deeper into inefficiencies within functions.
To install line_profiler, simply run:
pip install line_profiler
Unlike function-level profilers, line_profiler provides detailed execution times for individual lines of code .
Why Use line_profiler?
- Detailed Timing: See exactly how long each line takes to run.
- Spot Slowdowns: Pinpoint the exact operations that are slowing down your code.
When Should You Use It?
- When analyzing computation-heavy functions.
- When working with large datasets or optimizing critical code paths that demand high performance.
However, keep in mind that line_profiler adds some profiling overhead, which can slightly affect accuracy in performance-critical scenarios . For production environments or analyzing concurrent code, tools like py-spy or Yappi might be better suited.
Best Practices
A smart approach is to use cProfile first to identify problematic functions. Then, switch to line_profiler for a deeper dive into those specific areas . This combination ensures you’re focusing on the right sections of your code for optimization.
If you’re more concerned about memory usage rather than execution time, consider using memory_profiler as a complementary tool. It provides insights into how your code handles memory, adding another layer of performance analysis.
3. memory_profiler: Tracking Memory Usage in Python
For Python developers working on memory-heavy applications, memory_profiler is a go-to tool. It helps pinpoint memory leaks and optimize resource-intensive operations by providing detailed insights into how your code uses memory.
How to Get Started
Install memory_profiler using pip:
pip install memory_profiler
To analyze a function's memory usage, apply the @profile decorator:
from memory_profiler import profile

@profile
def memory_intensive_function():
    pass
Features That Make It Stand Out
| Feature | What It Does |
|---|---|
| Line-by-Line Memory Tracking | Monitors memory usage for each line of code and generates clear reports |
| Memory Leak Detection | Identifies leaks and tracks overall memory consumption |
Where It Shines
memory_profiler is especially useful in scenarios like:
- Handling large datasets in data pipelines
- Managing long-running server applications
- Optimizing memory usage in machine learning workflows
Things to Keep in Mind
Since memory_profiler adds some overhead, it's best to use it on specific functions rather than profiling your entire application.
Tips for Effective Use
- Focus on Problem Areas: Use memory_profiler on sections of code that are likely to consume the most memory.
- Combine with Other Tools: Pair it with timing tools if you also need to analyze execution speed.
- Monitor Regularly: Keep an eye on memory usage throughout development to avoid unexpected issues.
While memory_profiler is great for memory tracking, tools like py-spy are better suited for CPU profiling with minimal impact on performance.
4. py-spy: Low-Impact CPU Profiler
py-spy is a Python profiler built for live environments. It gives you real-time performance insights while keeping its impact on your application minimal. Unlike many traditional profilers, py-spy works seamlessly in production, making it a handy tool for developers.
Installation and Basic Usage
Getting started with py-spy is simple. Install it with:
pip install py-spy
To profile a running Python process, just run:
py-spy --pid <process_id>
Features at a Glance
| Feature | What It Does |
|---|---|
| Non-invasive Profiling | Works without needing code changes or restarts |
| Minimal Overhead | Safe to use even in production environments |
| Real-time Analysis | Quickly identifies performance bottlenecks |
Tips for Advanced Users
- Zero in on key sections of your application and track changes over time.
- Pair py-spy with memory profiling tools for a more complete view of performance.
- Focus on profiling parts of your app that handle heavy traffic or use the most resources.
Best Practices
- Always profile in environments that closely match production.
- Use py-spy to analyze areas of your application under high load.
- Review profiling data methodically to pinpoint areas for optimization.
Known Limitations
As a sampling profiler, py-spy might not catch every function call. If your needs include detailed memory tracking or full call stack analysis, consider combining it with tools like memory_profiler.
While py-spy is excellent for CPU profiling, you might also explore tools like Pyinstrument for a more visual breakdown of call stacks.
5. Pyinstrument: Call Stack Profiler
Pyinstrument is a tool designed to help developers pinpoint performance issues by providing a clear and detailed view of the call stack. You can install it with pip install pyinstrument and start profiling your script by running pyinstrument your_script.py.
Key Features
| Feature | Description |
|---|---|
| Interactive Call Stack View | Displays a detailed execution tree to spot performance bottlenecks easily. |
| Sampling Mode | Profiles with minimal overhead, making it safe for production use. |
| Real-time Performance Insights | Offers immediate feedback during code execution. |
Practical Usage
Pyinstrument's sampling mode is ideal for profiling in environments where performance overhead needs to stay low, such as production. The tool generates HTML reports, making it simple to share findings with your team. Additionally, it works well alongside tools like memory_profiler for a broader view of your program's performance. For a complete analysis, consider using Pyinstrument with tools like cProfile to quickly locate bottlenecks or line_profiler for precise timing at the line level.
Important Considerations
While Pyinstrument is excellent for visualizing call stacks and providing high-level insights, its sampling-based approach may miss some function calls. If you need a more granular analysis of specific code sections, combining it with line-level profiling tools can be helpful. For a broader performance overview, tools like Scalene can complement Pyinstrument by analyzing both CPU and memory usage.
6. Scalene: CPU and Memory Analysis
Scalene is a powerful Python profiler designed to analyze both CPU and memory usage at the same time, all while keeping performance overhead low. Unlike tools like py-spy, which focus solely on CPU profiling, Scalene gives you a clear picture of both CPU and memory behavior.
Key Features
| Feature | Description | Why It Matters |
|---|---|---|
| Multi-threaded Analysis | Monitors resource usage across threads | Helps improve performance in parallel code |
| Memory Leak Detection | Tracks allocation and deallocation patterns | Pinpoints memory management issues |
| Low Overhead Profiling | Minimal impact on application performance | Works well even in production setups |
| Continuous Monitoring | Provides real-time performance data | Enables on-the-fly improvements |
Scalene's ability to track both CPU and memory usage makes it a go-to tool for applications handling large datasets or performing complex calculations. Its memory tracking capabilities are especially useful for identifying leaks and understanding allocation patterns. The multi-threaded analysis and real-time monitoring features make it a great choice for optimizing parallel and memory-heavy code.
Why Use Scalene?
Scalene works well alongside other profiling tools, creating a more complete optimization process. For example, pair it with tools like cProfile or Pyinstrument to dig deeper into specific performance bottlenecks.
In addition to detecting memory leaks, Scalene provides detailed insights into how memory is allocated across threads. This broader view helps you focus on the most resource-intensive areas of your application. Use its in-depth statistics to guide your optimization efforts effectively.
For developers who need even more specialized tools, Intel Tiber can complement Scalene by offering advanced, application-level performance analysis. Together, these tools can help you fine-tune your code with precision while keeping performance impacts minimal.
7. Intel Tiber App-Level Optimization

Intel Tiber App-Level Optimization is a free, open-source production profiler built specifically for tracking performance in real-time. Unlike development-focused tools, this profiler is designed for live production environments, where immediate performance insights are key.
Key Features
| Feature | Description | Why It Matters |
|---|---|---|
| Continuous Profiling | Monitors performance in real time | Detects issues as they happen in production |
| Multi-Language Support | Compatible with various programming languages | Simplifies analysis for complex, multi-language apps |
| Process Filtering | Focuses on specific processes | Zeroes in on critical parts of your application |
| Time Period Selection | Examines performance over custom timeframes | Helps spot trends and recurring issues |
| Team Collaboration | Allows data sharing and graph exports | Makes teamwork across departments easier |
Compared to tools like Scalene, which is great for memory tracking, Intel Tiber is built for production use. It supports multi-language applications, giving you a more complete view of your system’s performance. This makes it easier to catch bottlenecks that tools like cProfile or line_profiler might overlook.
How to Use It Effectively
Intel Tiber is incredibly versatile for managing production systems. You can combine it with other tools, like Scalene for memory usage insights or cProfile for detailed function-level analysis, to build a more complete profiling setup.
Built for Production
With features like process filtering, custom time analysis, and easy data sharing, Intel Tiber is perfect for monitoring performance without disrupting production workflows. For Python developers, it’s especially useful for tracking critical scripts in real time, ensuring they perform smoothly under production loads.
This profiler provides a complete view of system performance, covering both CPU and memory usage across multiple processes. Its user-friendly interface lets you quickly identify CPU usage patterns across your entire application while keeping performance steady.
Conclusion
Each of the tools discussed tackles specific challenges in Python performance optimization. Here's a quick look at what they specialize in:
| Tool | Primary Use Case |
|---|---|
| cProfile | Provides function-level stats for general profiling |
| line_profiler | Delivers line-by-line insights for pinpointing bottlenecks |
| memory_profiler | Tracks memory allocation and detects leaks |
| py-spy | Offers low-overhead monitoring, ideal for production |
| Pyinstrument | Focuses on detailed function tracking and call stack analysis |
| Scalene | Combines CPU and memory usage tracking for resource efficiency |
| Intel Tiber | Enables real-time monitoring in live environments |
If you're working in a development setup, cProfile and line_profiler are great for detailed performance analysis. On the other hand, tools like memory_profiler and Scalene are perfect for spotting memory issues in resource-heavy applications .
For production environments, py-spy and Intel Tiber shine. They allow real-time profiling with minimal impact on your application's performance, making them ideal for continuous monitoring .
To get the best results, consider combining tools. Start with cProfile to get an overview, then dive deeper with specialized tools like line_profiler or memory_profiler . The key is to choose tools that match your application's specific needs, helping you catch and fix performance issues before they affect users .
FAQs
What is the best Python profiling tool?
The right profiling tool depends on what you’re trying to optimize. Here’s a quick breakdown to help you decide:
| Tool | Best For |
|---|---|
| cProfile | General performance analysis during development |
| line_profiler | Line-by-line analysis to find bottlenecks |
| memory_profiler | Monitoring memory usage and spotting leaks |
| py-spy | Low-overhead, real-time profiling in production |
| Scalene | Analyzing both CPU and memory usage |
| Pyinstrument | Visualizing call stacks for function tracking |
| Intel Tiber | Real-time monitoring in live environments |
For production scenarios, py-spy and Intel Tiber are great options as they provide real-time data with minimal impact on performance . If your focus is on memory-heavy tasks, tools like Scalene and memory_profiler are better suited for the job .
"Expert knowledge is crucial for selecting the appropriate profiling tool, interpreting profiling data, and implementing optimizations. Understanding the limitations and strengths of each tool helps developers choose the right tool for their specific needs" .


