

Discover the top 10 open source analytics platforms for 2024, offering feature-rich, customizable, and scalable solutions with strong community support.
Open source analytics platforms offer cost-effective and customizable solutions for collecting, processing, analyzing, and visualizing data. They provide access to source code, community-driven development, flexibility, and interoperability.
This article explores the top 10 open source analytics platforms for 2024, evaluated based on feature richness, customizability, scalability, community support, and user experience.
Platform
Key Features
Event autocapture, trend analysis, dashboards, funnels, path analysis, retention tracking
Customizable dashboards, real-time reporting, visitor profiling, heatmaps, session recordings, A/B testing
Visual query builder, automated reports, interactive dashboards, multi-data source support
Lightweight script, essential website metrics, event and goal conversion tracking, GDPR compliant
Connects to various SQL databases, powerful SQL query editor, over 40 chart types, Deck.GL integration
Multiple data sources, interactive dashboards, alerts, robust query editor
Multiple data sources, robust query editor, visualization options, dashboards
Real-time tracking, customizable dashboards, event and ecommerce tracking, content analytics, conversion funnel analysis
Dashboards, funnel analysis, retention tracking, crash analytics
Pageviews, devices used, visitor origin tracking
By leveraging open source analytics platforms, organizations can save costs, gain control over their data, and make informed, data-driven decisions.
How We Chose These Platforms
Before we dive into the list, it's essential to understand the criteria used to select these platforms. We evaluated each platform based on the following key factors:
Criteria
Description
Feature Richness
The range of analytics capabilities, data visualization options, and reporting features offered by each platform.
Customizability
The ability to tailor the platform to meet specific organizational needs, including integrations with existing systems and data sources.
Scalability
The platform's ability to handle large volumes of data, support multiple users, and adapt to growing organizational demands.
Community Support
The availability and quality of community-driven resources, such as documentation, forums, and tutorials.
User Experience
The ease of use, intuitiveness, and overall usability of the platform for both technical and non-technical users.
By considering these factors, we can ensure that the selected platforms provide a comprehensive analytics solution that meets the needs of various organizations.
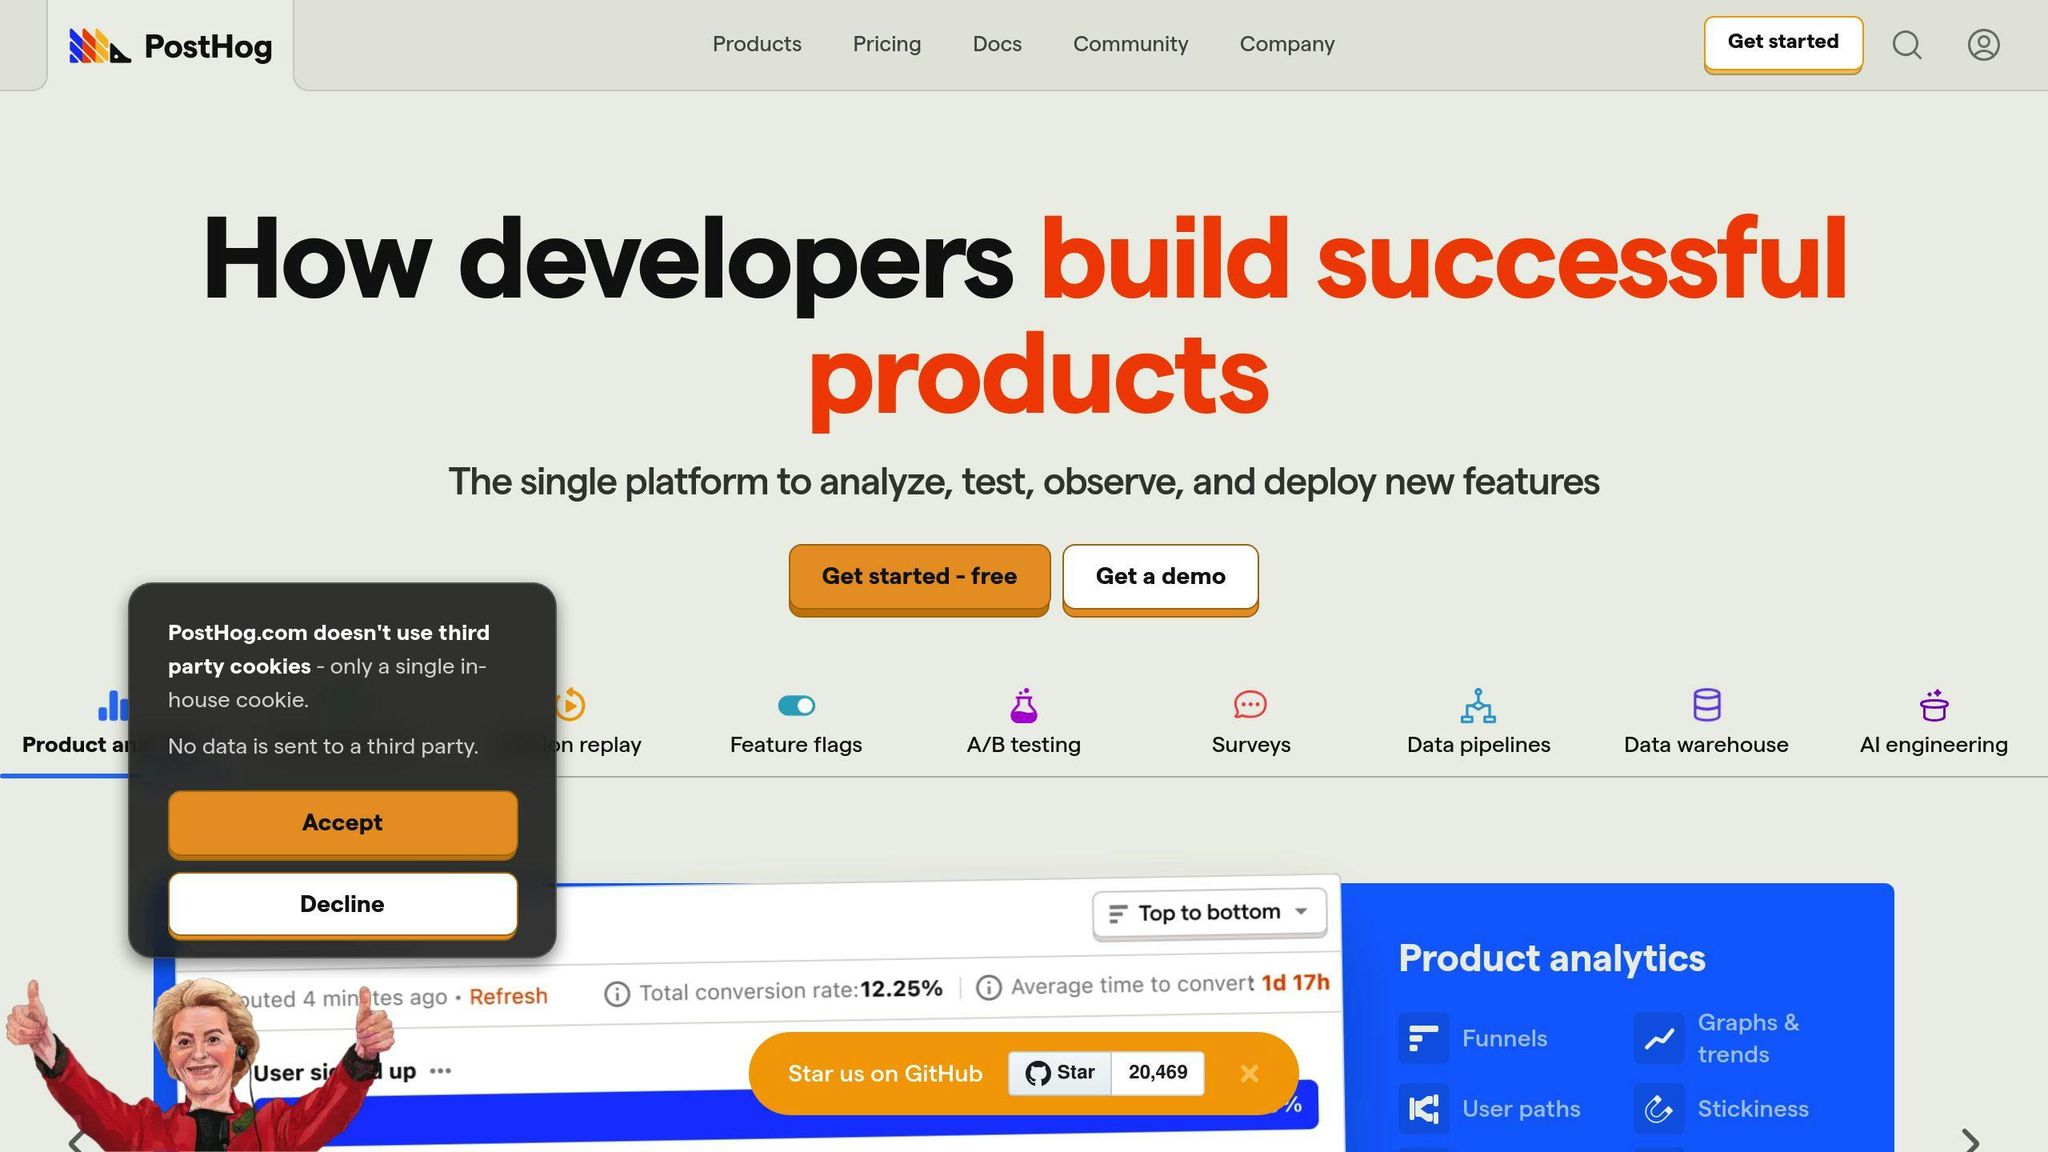
1. PostHog
Feature Richness
PostHog is an all-in-one, open-source analytics platform that offers a wide range of features for product analytics, session recording, feature flags, and experimentation. It provides trend analysis, dashboards, funnels, path analysis, retention tracking, and more.
Key Features
Feature
Description
Event Autocapture
Collect useful data immediately without instrumenting events by hand
Trend Analysis
Analyze data trends to make informed decisions
Dashboards
Visualize key metrics and analytics
Funnels
Track user journeys and identify drop-off points
Path Analysis
Analyze user behavior and identify patterns
Retention Tracking
Track user retention and identify areas for improvement
Customizability
PostHog is highly customizable, allowing users to self-host on existing infrastructure using Docker Compose. This provides full control over data and infrastructure. Additionally, PostHog provides APIs to integrate with data warehouses, enabling users to connect to external services and manage data flows.
Customization Options
Option
Description
Self-Hosting
Host PostHog on existing infrastructure using Docker Compose
API Integration
Integrate with data warehouses using APIs
Data Flow Management
Manage data flows between PostHog and external services
Scalability
PostHog is designed to scale with growing organizational demands. It can handle large volumes of data and support multiple users, making it an ideal solution for businesses of all sizes. Additionally, PostHog offers a cloud-hosted option, PostHog Cloud, which provides a fully-managed service with servers hosted in Frankfurt, Germany.
Scalability Features
Feature
Description
Large Data Handling
Handle large volumes of data
Multi-User Support
Support multiple users
Cloud-Hosted Option
Fully-managed service with servers hosted in Frankfurt, Germany
Community Support
PostHog has a large and active community of developers, with over 411 contributors and 110,000+ developers in the community. The platform provides extensive documentation, including a getting started guide, tutorials, and API references. Additionally, PostHog offers community support through its forums and GitHub issues.
Community Resources
Resource
Description
Documentation
Extensive documentation, including getting started guide, tutorials, and API references
Forums
Community support through forums
GitHub Issues
Community support through GitHub issues
User Experience
PostHog provides an intuitive and user-friendly interface, making it easy for both technical and non-technical users to navigate. The platform offers a comprehensive dashboard that provides a clear overview of key metrics and analytics, allowing users to make data-driven decisions.
User Experience Features
Feature
Description
Intuitive Interface
Easy to navigate for both technical and non-technical users
Comprehensive Dashboard
Clear overview of key metrics and analytics
Data-Driven Decision Making
Make informed decisions with data-driven insights
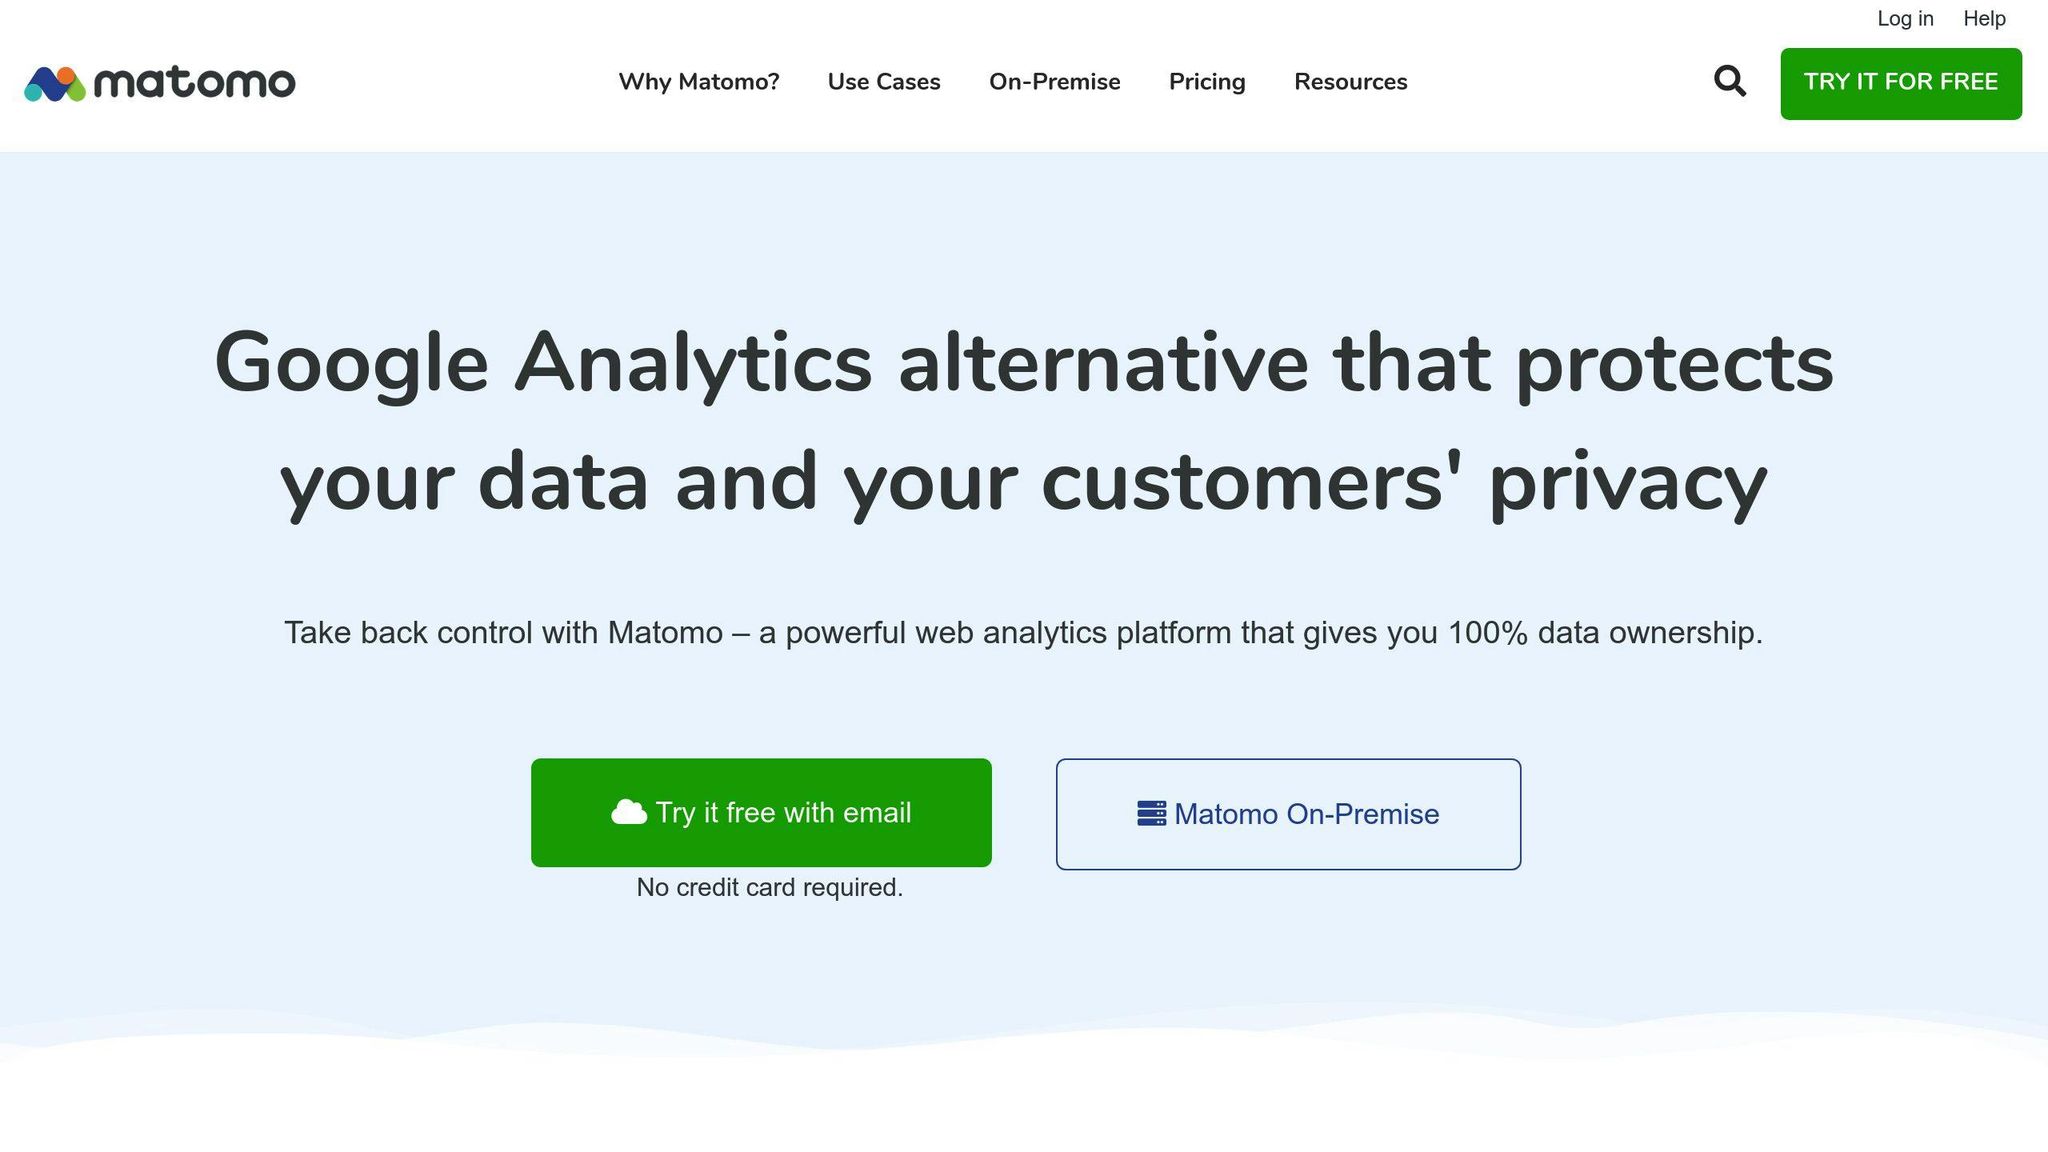
2. Matomo
Feature Richness
Matomo is an open-source analytics platform that offers a range of features for tracking website analytics. It provides customizable dashboards, real-time reporting, and visitor profiling. Additionally, Matomo offers heatmaps, session recordings, and A/B testing capabilities, making it a comprehensive tool for understanding user behavior.
Key Features
Feature
Description
Customizable Dashboards
Create personalized dashboards to track key metrics
Real-time Reporting
Get instant insights into website performance
Visitor Profiling
Understand individual user behavior and preferences
Heatmaps
Visualize user interactions with your website
Session Recordings
Replay user sessions to identify areas for improvement
A/B Testing
Test and optimize website elements for better performance
Customizability
Matomo is highly customizable, allowing users to tailor the platform to their specific needs. It offers plugins and integrations with popular content management systems, e-commerce platforms, and online forums. Additionally, Matomo provides APIs for custom development and integration with external services.
Customization Options
Option
Description
Plugins
Extend Matomo's functionality with plugins for specific use cases
Integrations
Integrate Matomo with popular platforms like WordPress, Magento, and Joomla
APIs
Develop custom solutions using Matomo's APIs
Self-Hosting
Host Matomo on your own infrastructure for full control
Scalability
Matomo is designed to scale with growing organizational demands. It can handle large volumes of data and support multiple users, making it an ideal solution for businesses of all sizes. Additionally, Matomo offers a cloud-hosted option, providing a fully-managed service with servers hosted in various locations.
Scalability Features
Feature
Description
Large Data Handling
Handle large volumes of data with ease
Multi-User Support
Support multiple users with customizable access levels
Cloud-Hosted Option
Fully-managed service with servers hosted in various locations
Community Support
Matomo has a large and active community of developers, with extensive documentation, tutorials, and community forums. The platform also offers commercial support and services for users who require additional assistance.
Community Resources
Resource
Description
Documentation
Extensive documentation, including getting started guides and API references
Tutorials
Step-by-step tutorials for setting up and using Matomo
Community Forums
Active community forums for discussing issues and sharing knowledge
User Experience
Matomo provides an intuitive and user-friendly interface, making it easy for both technical and non-technical users to navigate. The platform offers a comprehensive dashboard that provides a clear overview of key metrics and analytics, allowing users to make informed decisions.
User Experience Features
Feature
Description
Intuitive Interface
Easy to navigate for both technical and non-technical users
Comprehensive Dashboard
Clear overview of key metrics and analytics
Data-Driven Decision Making
Make informed decisions with data-driven insights
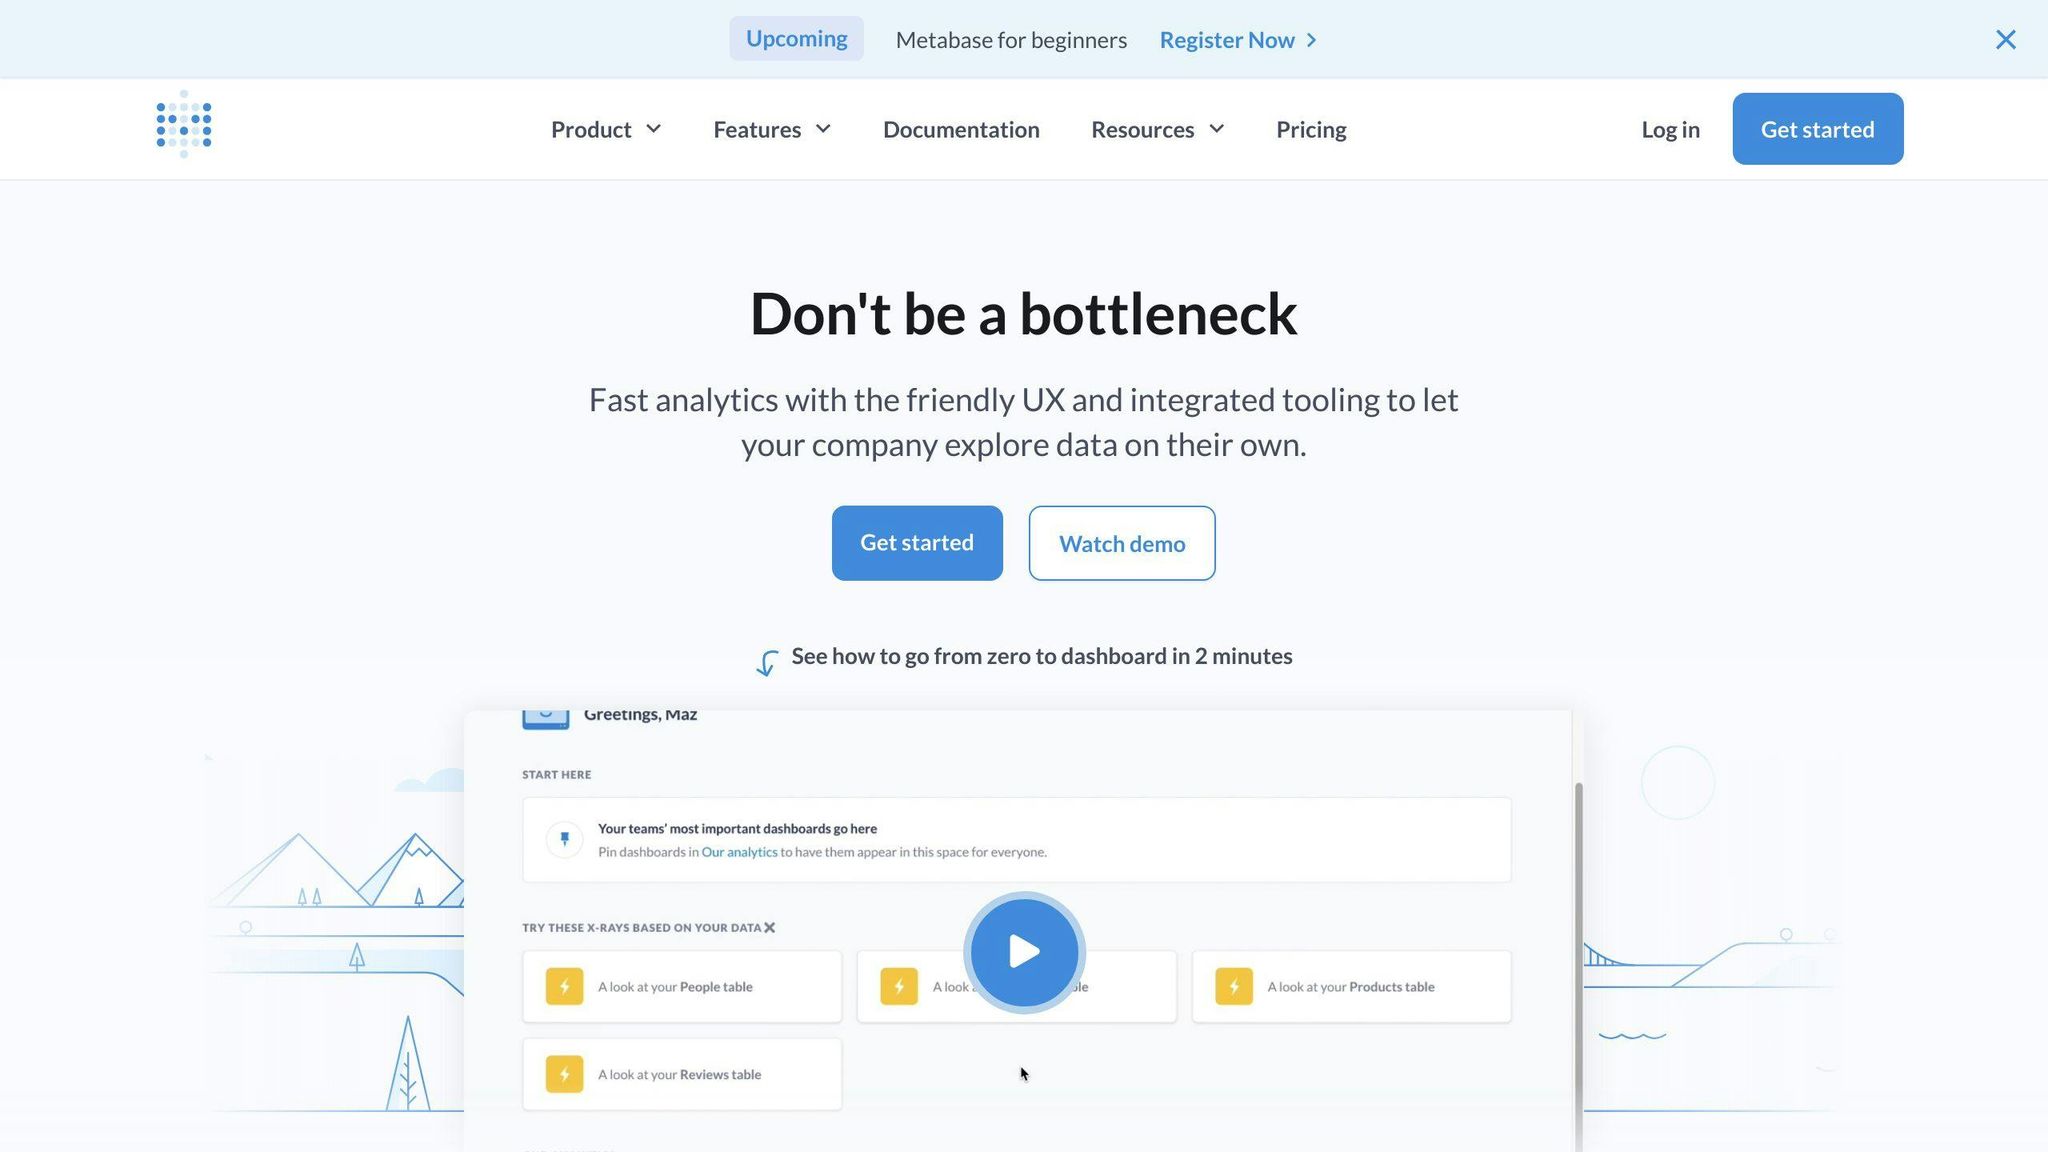
3. Metabase
Feature Richness
Metabase is an open-source business intelligence tool that offers a range of features for data visualization and analysis. It provides a visual query builder, allowing users to create dashboards and reports without requiring SQL knowledge. Additionally, Metabase supports automated reports, interactive dashboards, and integrations with over 20 data sources.
Key Features
Feature
Description
Visual Query Builder
Create dashboards and reports without SQL knowledge
Automated Reports
Schedule reports to be sent to stakeholders
Interactive Dashboards
Explore data in real-time with interactive dashboards
Multi-Data Source Support
Connect to over 20 data sources, including databases and spreadsheets
User Experience
Metabase is designed to be user-friendly, with a drag-and-drop interface that makes it easy to create dashboards and reports. The platform also provides a native SQL editor for advanced users, allowing them to write custom queries.
User Experience Features
Feature
Description
Drag-and-Drop Interface
Easily create dashboards and reports without coding
Native SQL Editor
Write custom queries for advanced data analysis
Community Support
Metabase has an active community of developers and users, with extensive documentation and community forums. The platform also offers commercial support and services for users who require additional assistance.
Community Resources
Resource
Description
Documentation
Extensive documentation, including getting started guides and API references
Community Forums
Active community forums for discussing issues and sharing knowledge
Commercial Support
Additional support and services for users who require assistance
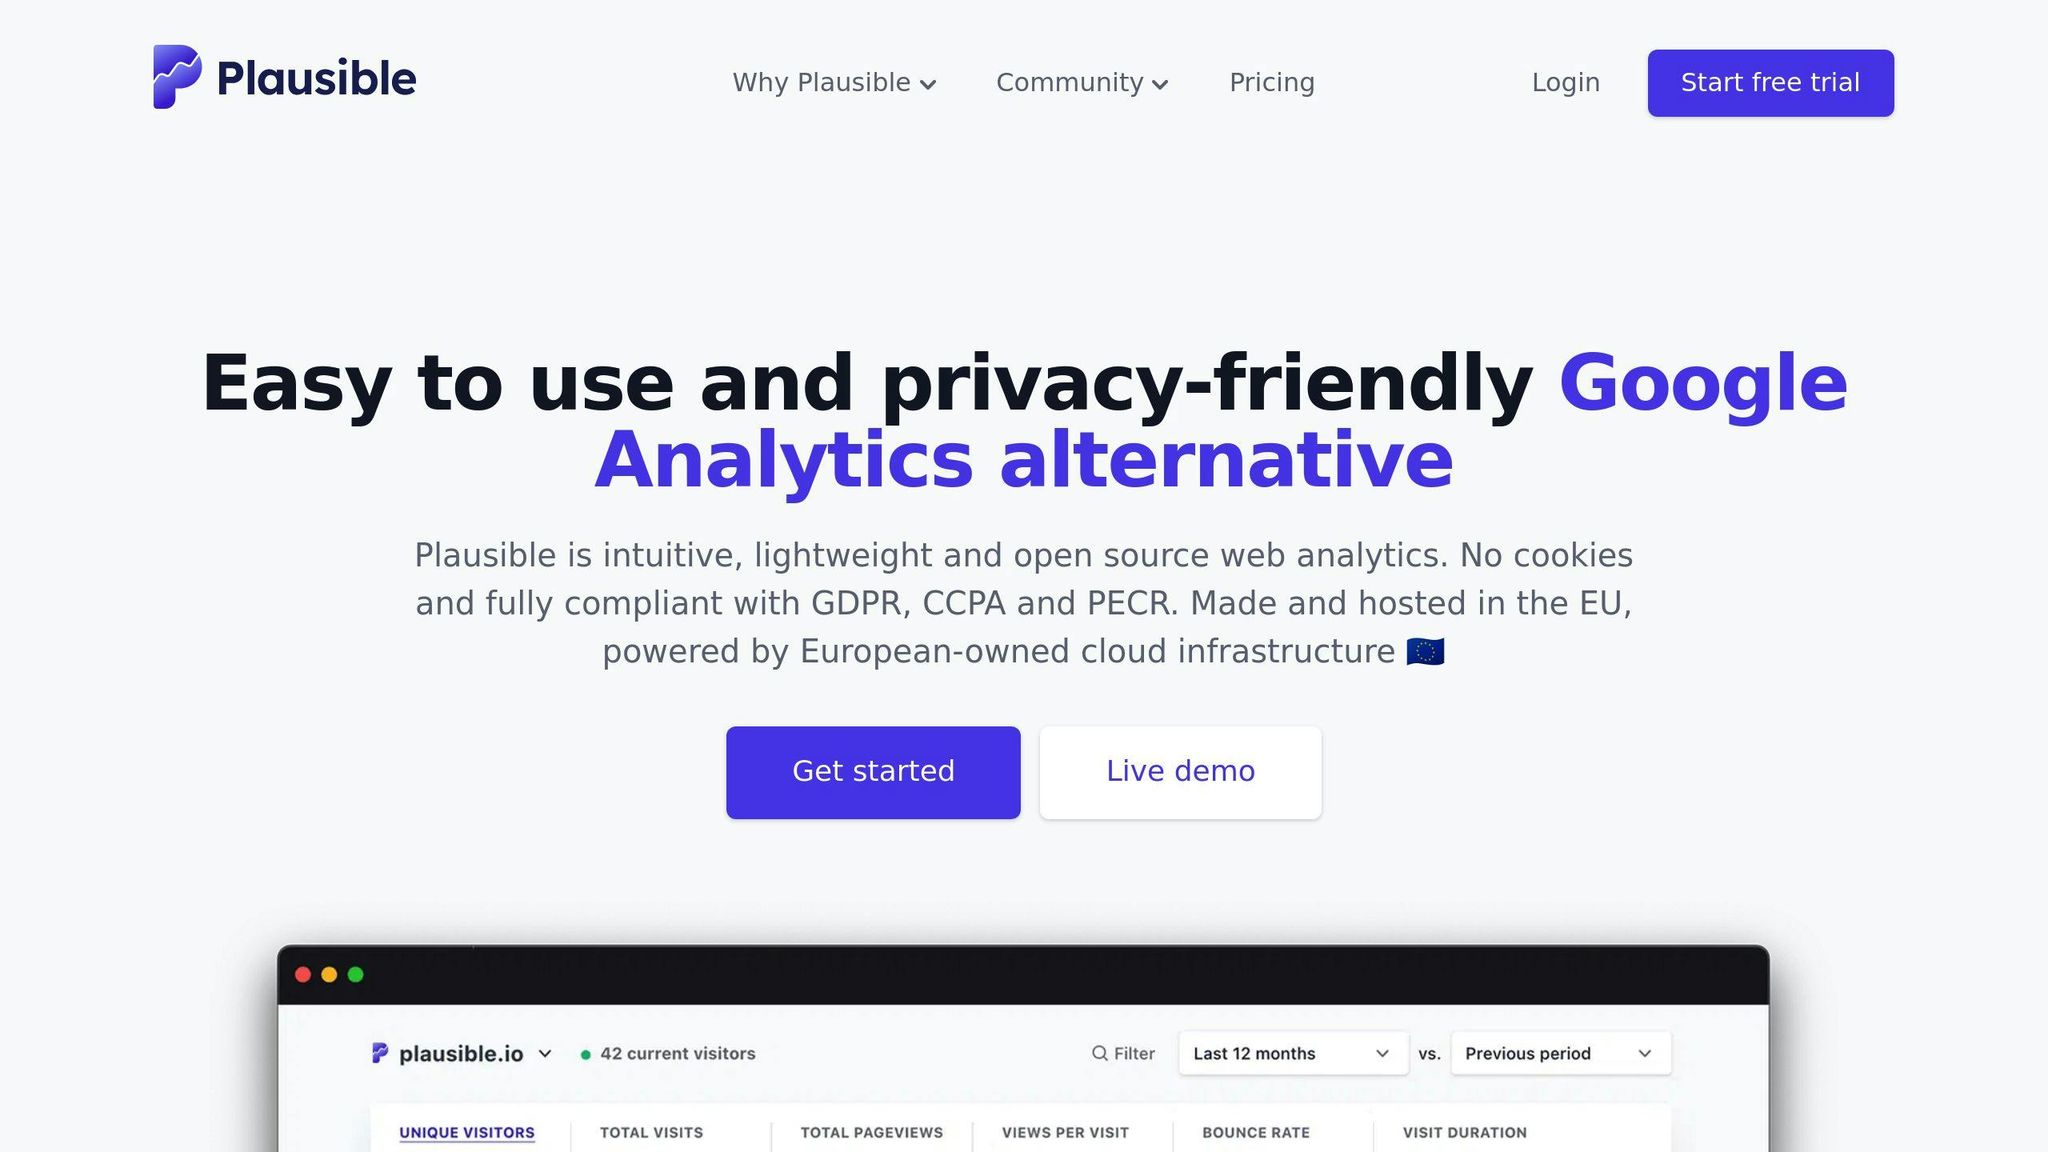
4. Plausible Analytics
Feature Richness
Plausible Analytics is a lightweight, open-source web analytics platform that prioritizes user privacy. It provides essential website metrics, including unique visitors, page views, bounce rate, and referrers. Plausible also offers event and goal conversion tracking, making it easy to monitor website performance.
Key Features
Feature
Description
Lightweight Script
Less than 1KB, ensuring no impact on page performance
Essential Website Metrics
Unique visitors, page views, bounce rate, and referrers
Event and Goal Conversion Tracking
Monitor website performance and conversions
GDPR Compliant
No cookies or personal data collection, ensuring user privacy
User Experience
Plausible Analytics is designed to be simple and easy to use, with a focus on essential metrics. The platform provides a clean and intuitive interface, making it easy to navigate and understand website performance.
User Experience Features
Feature
Description
Simple Interface
Easy to navigate and understand website performance
Essential Metrics
Focus on key metrics, avoiding unnecessary complexity
Community Support
Plausible Analytics has an active community of developers and users, with extensive documentation and community forums. The platform also offers a free trial and affordable pricing plans, making it accessible to users of all levels.
Community Resources
Resource
Description
Documentation
Extensive documentation, including getting started guides and API references
Community Forums
Active community forums for discussing issues and sharing knowledge
Free Trial and Affordable Pricing
Accessible to users of all levels, with a free trial and affordable pricing plans
5. Apache Superset
Feature Richness
Apache Superset is a powerful open-source business intelligence tool that offers a wide range of charting and visualization options. It connects to various SQL databases and has a large and active community. Superset provides a powerful web-based SQL query editor, over 40 chart types for data visualization, and Deck.GL integration for advanced geographic data visualization.
Key Features
Feature
Description
Connects to various SQL databases
Supports multiple SQL databases
Powerful web-based SQL query editor
Prepares data for visualization
Over 40 chart types
Offers various data visualization options
Deck.GL integration
Supports advanced geographic data visualization
Community Support
Apache Superset has a large and active community, with extensive documentation and community forums. It is also highly configurable, with a semantic layer, caching layer, and support for various SQL data sources.
Community Resources
Resource
Description
Documentation
Extensive documentation, including getting started guides and API references
Community Forums
Active community forums for discussing issues and sharing knowledge
Scalability
Apache Superset is designed to handle large data sets and provides extensive permissioning systems, allowing users to restrict access to sensitive data. It is ideal for enterprises with experienced in-house data teams.
Scalability Features
Feature
Description
Handles large data sets
Designed to handle large data sets
Extensive permissioning systems
Restricts access to sensitive data
User Experience
Apache Superset offers a modern data visualization platform with a state-of-the-art SQL IDE, no-code data exploration, and a semantic layer. It provides a rich set of visualization options and supports custom visualization plugins.
User Experience Features
Feature
Description
Modern data visualization platform
Offers a state-of-the-art SQL IDE and no-code data exploration
Rich set of visualization options
Supports over 40 chart types and custom visualization plugins
sbb-itb-bfaad5b
6. Grafana
Feature Richness
Grafana is a powerful open-source analytics platform that offers a range of features for data visualization and exploration. It connects to various data sources, including Prometheus, InfluxDB, and Elasticsearch, and provides a large collection of plugins for customization.
Key Features
Feature
Description
Multiple data sources
Supports Prometheus, InfluxDB, Elasticsearch, and more
Interactive dashboards
Customizable and interactive dashboards for data visualization
Alerts
Provides alerting capabilities for anomaly detection and notification
Robust query editor
Supports advanced querying and filtering capabilities
Community Support
Grafana has a large and active community, with extensive documentation and community forums. It is also highly customizable, with a wide range of plugins and integrations available.
Community Resources
Resource
Description
Documentation
Detailed guides and API references
Community Forums
Active forums for discussing issues and sharing knowledge
User Experience
Grafana offers a modern and intuitive user interface, with a focus on ease of use and customization. Its dashboards are highly customizable, with a wide range of visualization options and plugins available.
User Experience Features
Feature
Description
Modern UI
Easy to use and navigate
Customizable dashboards
Supports a wide range of visualization options and plugins
7. Redash

Feature Richness
Redash is a powerful open-source analytics platform that offers a range of features for data visualization and exploration. It connects to various data sources, including SQL databases, cloud storage, and NoSQL databases.
Key Features
Feature
Description
Multiple data sources
Supports various data sources
Robust query editor
Advanced querying and filtering capabilities
Visualization options
Offers charts, tables, and maps for data visualization
Dashboards
Create interactive dashboards for data visualization
Community Support
Redash has an active community, with extensive documentation and community forums. It is also highly customizable, with a wide range of plugins and integrations available.
Community Resources
Resource
Description
Documentation
Detailed guides and API references
Community Forums
Active forums for discussing issues and sharing knowledge
User Experience
Redash offers a simple and intuitive user interface, with a focus on ease of use and customization. Its dashboards are highly customizable, with a wide range of visualization options and plugins available.
User Experience Features
Feature
Description
Simple UI
Easy to use and navigate
Customizable dashboards
Supports various visualization options and plugins
Allows team members to work together on projects in real-time
8. Open Web Analytics
Open Web Analytics (OWA) is a free, open-source web analytics software that provides an alternative to Google Analytics while giving users full control over their data. It's a powerful tool that helps you understand how well your website is performing.
Feature Richness
OWA offers several advanced features, including:
Feature
Description
Real-time tracking
Monitor your website's performance in real-time
Customizable dashboards
Create tailored views of your website's analytics
Event and ecommerce tracking
Track specific events or actions on your website
Content analytics
Analyze how users interact with your content
Conversion funnel analysis
Identify areas where users drop off in the conversion process
Customizability
OWA is highly customizable, allowing you to create custom reports and track specific events or actions on your website. It also supports integration with popular frameworks like WordPress and MediaWiki.
Community Support
OWA has a dedicated community and extensive documentation, making it easy to get started and troubleshoot any issues that may arise.
User Experience
OWA provides a simple and intuitive user interface, making it easy to navigate and understand your website's analytics. Its dashboards are highly customizable, allowing you to create a tailored view of your website's performance.
Overall, Open Web Analytics is a solid choice for those looking for a self-hosted analytics solution with advanced features and customization options.
9. Countly
Feature Richness
Countly is an open-source product analytics platform that offers a range of tools to help you build better products. It focuses on mobile and desktop applications, and enables you to combine both qualitative and quantitative insights. Key features include:
Feature
Description
Dashboards
Visualize key metrics and analytics
Funnel Analysis
Identify areas where users drop off
Retention Tracking
Monitor user retention and identify areas for improvement
Crash Analytics
Analyze app crashes to improve performance
Customizability
Countly allows you to create custom dashboards, build your own plugins, or add new functionalities to increase your ROI. You can also create metrics specific to your business and track events you define from your app.
Community Support
Countly has a dedicated community and extensive documentation, making it easy to get started and troubleshoot any issues that may arise. It also offers an enterprise version with extra features like A/B testing and customer feedback.
User Experience
Countly provides a simple and intuitive user interface, making it easy to navigate and understand your product's analytics. Its dashboard is easy to use, and you can quickly access important information such as sessions, events, new users, etc.
10. Umami
Feature Richness
Umami is a simple, fast, and privacy-focused open-source web analytics solution. It collects essential metrics, including pageviews, devices used, and where your visitors are coming from. Umami measures important metrics and displays them on a single, easy-to-browse page.
Key Features
Feature
Description
Pageviews
Track the number of times users visit your website
Devices used
Identify the devices your visitors use to access your website
Visitor origin
See where your visitors are coming from
Customizability
Umami is highly customizable, allowing you to tailor it to your needs. You can track basic events, such as button clicks, using CSS classes or JavaScript. Additionally, Umami offers a free cloud hosting option, making it easy to get started.
Community Support
Umami has an active community and extensive documentation, making it easy to get started and troubleshoot any issues that may arise. Its open-source nature also allows for community contributions and plugins, ensuring that the platform continues to evolve and improve.
User Experience
Umami provides a clean, intuitive, and modern interface for analyzing your website traffic. It's lightweight, fast, and focused on delivering actionable insights. You can track real-time user activity, views, and events, giving you a better understanding of your website's performance.
Final Thoughts
In this article, we've explored the 10 best open source analytics platforms in 2024. Each platform offers a unique set of features, customization options, and scalability. By choosing an open source analytics platform, organizations can save costs and gain greater control over their data.
Key Considerations
When implementing open source analytics tools, consider the following:
Factor
Description
Planning
Proper planning is essential for optimal performance and security.
Training
Ensure users receive adequate training to get the most out of the platform.
Updates
Regularly update the platform to ensure security and performance.
Integrating with AI and Cloud-Based Solutions
Integrating open source analytics platforms with AI and machine learning capabilities, as well as leveraging cloud-based solutions, can enable:
Capability
Description
Advanced Analytics
Unlock advanced analytics and real-time insights.
Scalability
Scale your analytics capabilities to meet growing demands.
Choosing the Right Platform
Remember, open source analytics platforms offer cost savings and customization options, but may require technical expertise and community support. By carefully evaluating your organization's needs and choosing the right platform, you can unlock the full potential of open source analytics and drive data-driven decision-making.
FAQs
What is open source data analytics?
Open source data analytics software is software that allows users to view, modify, and distribute its source code. This type of software is designed to be publicly accessible and is often managed and maintained by a community of developers and users. It provides tools to collect, process, analyze, and visualize data.
What is an open source reporting tool?
An open source reporting tool is a software application that is free to use and modify. It is developed collaboratively by a community of developers and users and can be used for various purposes, such as data analysis, reporting, and visualization. These tools allow users to explore data and uncover trends, correlations, and insights.
Key Features of Open Source Reporting Tools
Feature
Description
Free to use
No cost or licensing fees
Modifiable
Users can modify the source code
Collaborative development
Developed by a community of developers and users
Data analysis
Analyze data to uncover trends and insights
Reporting
Create reports to present findings
Visualization
Visualize data to make it easier to understand


