

Measure developer marketing with proxy metrics, PQLs, TTFV, and dashboards that connect engagement to ARR and pipeline.
Proving ROI in developer marketing is tough but not impossible. Unlike traditional B2B marketing, developers discover tools through untracked channels like GitHub, Slack, and word-of-mouth. They evaluate products anonymously, making attribution and measurement a challenge. Without clear ROI metrics, marketing teams risk being undervalued.
Here’s what you need to know:
- Challenges: Long sales cycles, bottom-up adoption, and the "dark funnel" (52% of developer tool discovery happens through unmeasurable channels).
- Solutions: Use proxy metrics like branded search, API key creation, and Product Qualified Leads (PQLs). Focus on engagement signals such as documentation depth and Time to First Value (TTFV).
- Reporting: Translate developer metrics into business terms (e.g., ARR, CAC, NDR). Build dashboards that highlight actionable metrics for leadership.
- Benchmarks: Early-stage companies aim for 20–40% activation rates, while enterprise-level businesses target 130–150% Net Dollar Retention.
Why Developer Marketing ROI Is Harder to Measure
Long Sales Cycles and Bottom-Up Adoption
Developers don’t approach software purchases like traditional B2B buyers. In a standard enterprise sale, a VP or executive pinpoints a need, evaluates vendors, and makes a decision - all within a predictable, trackable timeline. Developer tools, however, follow a different path. A developer might stumble upon your product, tinker with it anonymously for months, create a proof-of-concept, and only then suggest it to their team. By the time a deal closes, the early marketing touchpoints are buried beneath layers of untracked activity.
This bottom-up adoption model presents a unique challenge: developers influence decisions but rarely make them outright. They’re not the ones signing contracts or approving budgets. Marketing might initiate the journey with a signup, but product teams handle the critical free-to-paid conversion through onboarding and documentation. This division makes it difficult for marketing to attribute revenue directly to their efforts . As developer advocate Dewan Ahmed explains:
"Developer advocacy is the only role in a technology company that gets held accountable for both what it produces and what it causes. At the same time. With no agreed model for connecting the two" .
Things get even more complex with enterprise procurement cycles. Security reviews, legal approvals, and budget discussions stretch the timeline. A developer might engage in January, trial your product in March, and only convert by September. This extended process makes ROI measurement tricky because traditional tools don’t capture these long, layered interactions. And this is just the beginning - tracking developer activity becomes even murkier when factoring in the so-called "dark funnel."
The Dark Funnel and Attribution Problems
Beyond timing issues, the "dark funnel" adds another layer of difficulty. Here’s the core problem: 52% of developer tool discovery happens through untracked channels . Developers find tools via private Slack channels, forums, or word-of-mouth. They often use ad blockers and have strict cookie settings, rendering traditional tracking methods ineffective. By the time they sign up for your product, your analytics might attribute the visit to "direct" traffic or "organic search", completely missing the podcast shoutout or Slack recommendation that actually brought them there.
This untracked activity - the "dark funnel" - is enormous. In fact, standard lead-based attribution models often miss up to 80% of the developer journey . This gap highlights how traditional attribution methods fall short. Rand Fishkin, founder of SparkToro, sums it up bluntly:
"Waste 50% of your budget to get more value from the other 50%" .
The contrast with traditional B2B marketing is striking. Enterprise buyers leave clear digital trails - think email campaigns or LinkedIn ads. Developers, on the other hand, roam through GitHub repositories, Stack Overflow threads, and technical documentation - channels that marketing automation tools aren’t designed to track. It’s no surprise, then, that 76% of developer-focused companies struggle with multi-touch attribution . The tools that work for tracking SaaS buyers simply can’t keep up with the nuanced, peer-driven behavior of developers.
sbb-itb-e54ba74
The Developer Marketing Metrics Framework
::: @figure 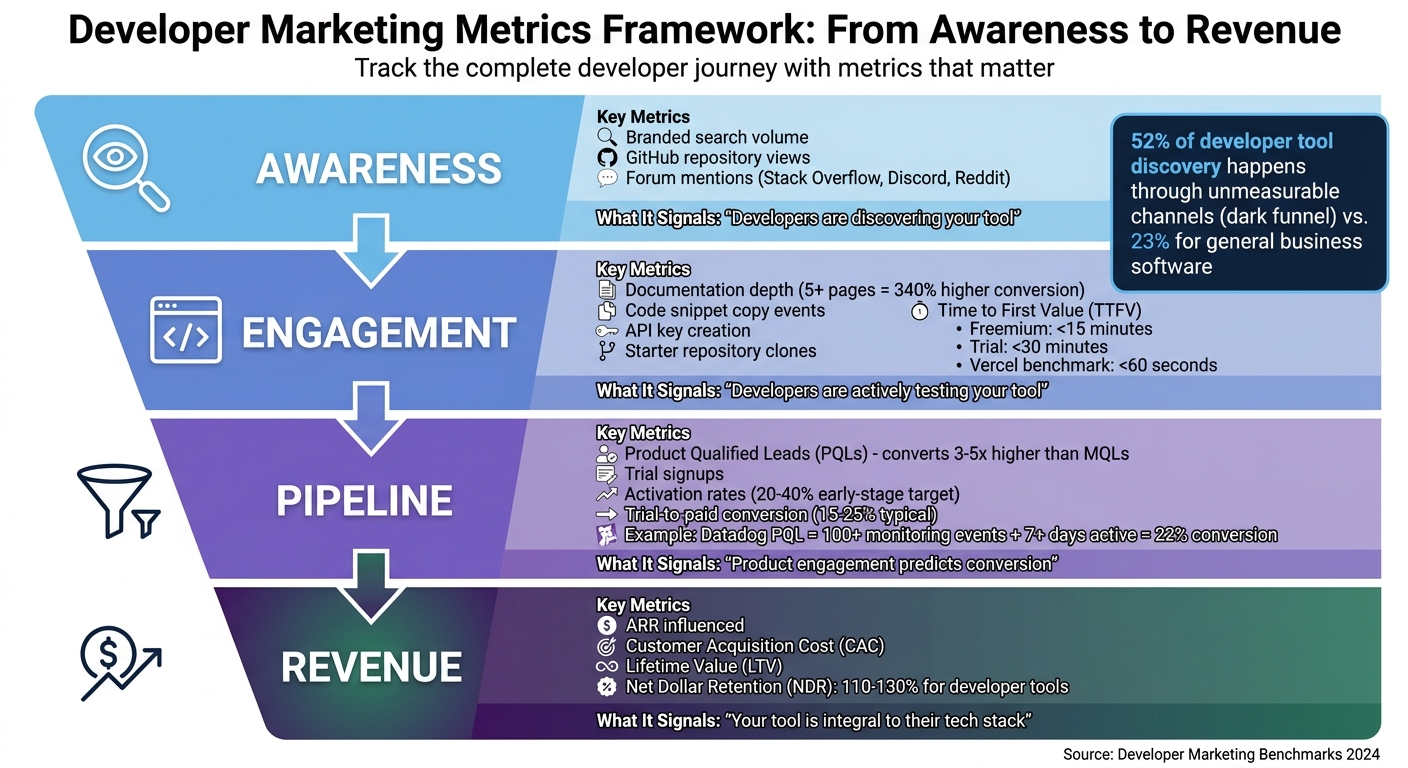 {Developer Marketing Metrics Framework: Awareness to Revenue}
Tackling the challenges of long sales cycles and the elusive "dark funnel", this framework connects developer interactions to measurable business goals. It tracks the entire developer journey - from their first encounter with your tool to becoming a paying customer. By focusing on key funnel stages - awareness, engagement, and pipeline/revenue - you can tie every developer action to meaningful business outcomes.
A whopping 89% of tech companies struggle to measure the success of their developer go-to-market strategies . The issue isn't a lack of data; it's figuring out which metrics actually matter. As sderosiaux from Developer Marketing Guides wisely notes:
"Only look at metrics that help you make decisions. If you track metrics and create dashboards but don't use them for decision-making, rethink your metrics" .
Here's a breakdown of what to measure at each stage, ensuring developer activity aligns with business impact.
Awareness Metrics
Awareness metrics focus on one key question: Are developers discovering your tool when researching solutions? Unlike traditional marketing, where impressions and reach dominate, developer awareness often happens in technical spaces - like GitHub, Stack Overflow, or communities such as Discord and Reddit .
Key things to track include:
- Branded search volume: Are developers searching for your product by name?
- Repository views and mentions in forums: Is your tool being referenced in technical discussions?
These indicators show whether your tool is making it onto developers' mental shortlists. Instead of chasing broad reach, prioritize visibility in the right technical conversations. Once awareness is established, you can shift focus to measuring deeper engagement.
Engagement Metrics
Once developers are aware of your tool, the next step is assessing how deeply they engage. This is where documentation becomes critical. For example, Stripe found that developers who interact with 5 or more unique documentation pages during their first session have a 340% higher conversion rate compared to single-page visitors . Clearly, deeper engagement leads to higher conversions.
Track these signals of active interest:
- Code snippet copy events: When developers copy sample code, they’re likely testing it locally .
- Starter repository clones and API key creation: These actions show developers are moving from curiosity to hands-on experimentation.
Another important metric is Time to First Value (TTFV) - how quickly a developer achieves a working result. Vercel set the bar high with deployments in under 60 seconds . For freemium products, aim for under 15 minutes, and for trial products, under 30 minutes . The faster developers see results, the less likely they are to abandon your tool.
Pipeline and Revenue Metrics
Developer activity ultimately needs to translate into business outcomes. Product Qualified Leads (PQLs) - users who demonstrate meaningful product engagement - convert at rates 3-5x higher than traditional Marketing Qualified Leads (MQLs) . Unlike MQLs, which rely on surface-level actions like form fills, PQLs are based on actual product usage.
For example, Datadog defines a PQL as a user who sends at least 100 monitoring events and stays active for 7+ days, leading to a 22% PQL-to-paid conversion rate . Your PQL definition should reflect real product engagement, not just profile completeness.
Other critical metrics include:
- Trial signups, activation rates, and trial-to-paid conversions (which typically range from 15-25% for developer tools) .
- Revenue-focused metrics like ARR influenced (revenue tied to marketing touchpoints), Customer Acquisition Cost (CAC), and Lifetime Value (LTV).
- Net Dollar Retention (NDR): Developer tools often achieve NDR between 110-130%, driven by increased usage rather than adding seats . This signals strong product-market alignment, as customers expand their usage over time.
| Funnel Stage | Key Metrics | What It Signals |
|---|---|---|
| Awareness | Branded search, GitHub views, forum mentions | Developers are discovering your tool |
| Engagement | Documentation depth, code copies, API keys, TTFV | Developers are actively testing your tool |
| Pipeline | PQLs, trial signups, activation rate | Product engagement predicts conversion |
| Revenue | ARR influenced, CAC, LTV, NDR | Your tool is integral to their tech stack |
How to Build a Developer Marketing Dashboard
A well-crafted dashboard highlights the metrics that truly matter, helping teams make informed decisions every day. It’s important to distinguish between two types of metrics: leading indicators and lagging indicators. Lagging metrics - like qualified signups, demo requests, and revenue - are ideal for reporting to leadership, especially when discussing budgets or ROI. On the other hand, leading metrics - such as documentation visits, code snippet copies, and API key creation - are tools for your marketing team to fine-tune campaigns and address any bottlenecks . Keeping these two types separate ensures clarity and avoids confusion.
Now, let’s dive into what your dashboard should include, what to leave out, and the best tools to track these metrics effectively.
What to Include in Your Dashboard
Start by focusing on activation signals like API key creation, successful CLI initialization, and Quickstart completions. These metrics show how quickly developers achieve their first success. Your top metric, often called the North Star, should track "Time to First Hello World" or "Time to First Success." The benchmarks for these vary depending on the product type:
- Auth/API libraries: 5–15 minutes
- Frameworks/SDKs: 15–45 minutes
- Infrastructure tools: 45–90 minutes .
Another key area is documentation depth. This goes beyond simple page views - track how deeply developers engage with your documentation and interact with code samples . Pay particular attention to high-intent pages like pricing, terms of service, and demo request pages. These are stronger indicators of purchase intent compared to general blog views . Additionally, monitor metrics like cohort retention and zero-result searches to spot trends in engagement and identify gaps in your content .
Since many developers (30%–70%) block tools like Google Analytics , it’s smart to add a self-reporting attribution question during signup. A simple "How did you hear about us?" field helps capture insights from harder-to-track sources like Slack, Discord, or podcasts . As Jakub Czakon, CMO and Dev Marketing Advisor, puts it:
"You treat marketing as a product and measure ROI at a program level. You optimize activities within the programs but don't report ROI on them" .
What to Exclude: Vanity Metrics
While building your dashboard, it’s just as important to leave out metrics that don’t drive meaningful insights. Vanity metrics like impressions and social shares can be misleading. Milica Maksimović, Co-founder of literally.dev, explains:
"Impressions are the worst vanity metric you can think of. Someone scrolling past your social media post without properly noticing it still counts as an impression" .
Metrics like these don’t reveal whether developers are progressing through the funnel. Similarly, avoid emphasizing LinkedIn engagement or social likes to executives - these numbers don’t reflect product adoption and can skew decision-making . Other metrics like bounce rate and total page views often highlight volume rather than meaningful behaviors. What truly matters is whether developers take the next step, like moving from a blog post to exploring the documentation .
Here’s a quick reference table:
| Metric Category | Exclude (Vanity) | Include (Actionable) |
|---|---|---|
| Awareness | Impressions, social shares | Branded search, high-intent page traffic |
| Engagement | Page views, bounce rate, social likes | API key creation, documentation depth, code copies |
| Conversion | Signups, MQLs | Product Qualified Leads (PQLs), activated signups |
| Retention | Total registered users | Monthly Active Developers (MAD), Net Dollar Retention (NDR) |
Tools for Tracking Developer Metrics
To make the most of your dashboard, you’ll need the right tools. For product and web analytics, platforms like Amplitude, Mixpanel, PostHog, or Heap are excellent for tracking user behavior and activation events . If your audience tends to block ads or trackers, privacy-first tools like Plausible are a great alternative - they’re GDPR-compliant and less likely to get blocked .
For community engagement, tools like Common Room and Orbit help track developer activities across platforms like GitHub and Discord . When it comes to documentation analytics, options like ReadMe, Swagger, Redocly, and GitBook Analytics allow you to monitor which pages are visited, how long users stay, and which code samples they interact with .
If you’re looking to identify anonymous visitors, tools like Koala can connect them to known accounts, making multi-touch journey tracking easier . Finally, for campaign insights, daily.dev Ads offers transparent data on impressions, clicks, and engagement - letting you see exactly how your efforts drive awareness and interaction with developer audiences.
Solving Attribution Challenges in Developer Marketing
When tackling the challenges of the dark funnel, understanding and tracking multi-touch journeys becomes essential. Attribution in developer marketing operates differently from traditional B2B models. This is largely because developers rely heavily on "dark social" channels like Slack, Discord, and private Twitter threads for recommendations and discussions . Add to this the widespread use of ad-blockers and cookie restrictions, and it’s clear why significant blind spots exist. Unlike the well-established MQL/SQL models in traditional B2B, developer marketing lacks standardized metrics that directly tie activities to outcomes .
Over half (52%) of developer tool discovery happens through unmeasurable channels, compared to just 23% for general business software . This means a huge portion of influence goes undetected by analytics tools. Developers also prefer to conduct thorough, anonymous research - visiting documentation and GitHub repositories multiple times before ever identifying themselves . By the time they sign up, many crucial touchpoints have already gone untracked.
How to Track Multi-Touch Developer Journeys
To address these challenges, combine software-based tracking with self-reported attribution. For example, include a "How did you hear about us?" question in your signup forms. This can help capture high-intent sources like podcasts, peer recommendations, or private communities - channels that software often misses . To test the accuracy of responses, include a non-relevant option (like "Billboards") to filter out noise .
For trackable interactions, a weighted, stage-based model works well. Assign credit across five key stages: Discovery (15%), Evaluation (25%), Trial (35%), Validation (20%), and Purchase (5%) . This model recognizes that most influence happens during hands-on evaluations, not just at the point of purchase. You can also apply a 30-day time-decay model to prioritize recent technical interactions, such as successful API integrations or positive support experiences .
Server-side tracking, using tools like API keys and authentication tokens, helps bypass ad-blockers . Additionally, holding quarterly journey walkthroughs with your sales team can shed light on the full history of touchpoints for enterprise customers . As Jakub Czakon, CMO of a dev tool startup, explains:
"You treat it as a product and measure ROI at a program level. You optimize activities within the programs but don't report ROI on them" .
Once multi-touch journeys are mapped, the next step is to focus on proxy metrics that highlight developer intent.
Proxy Metrics That Work for Developer Marketing
When direct attribution isn’t possible, proxy metrics can fill the gap. One important metric is Time to First Value (TTFV) - often called "Time to First Hello World." This measures how quickly a developer achieves a working result after their initial interaction . Ideally, TTFV should be under 5 minutes, though 5–15 minutes is acceptable for many API libraries . For example, Vercel has streamlined its deployment process to achieve a TTFV of under 60 seconds .
Documentation engagement is another powerful proxy. Tracking how deeply developers explore your documentation during their first session can reveal their intent to evaluate your tool. Actions like copying code snippets or using internal site search to solve specific challenges are strong indicators of interest .
Product Qualified Leads (PQLs) are also essential for measuring engagement. Datadog, for instance, defines a PQL as a user who sends at least 100 monitoring events and stays active for over seven days. This approach has led to a 22% PQL-to-paid conversion rate . PQLs often convert at rates 3–5 times higher than traditional MQLs . Other useful proxies include GitHub stars, API key creation rates, and detecting your tool's dependency files in production repositories. For example, Snap Inc.'s DevRel team used a custom CRM to track use cases for their Camera Kit SDK and discovered that education - not gaming - was driving adoption .
Using daily.dev Ads for Transparent Campaign Analytics
Proxy metrics become even more actionable when integrated into transparent campaign analytics. Platforms like daily.dev Ads provide detailed data on impressions, clicks, and engagement, all mapped to developer marketing KPIs. These insights show how your campaigns drive awareness and interaction, helping you identify which content resonates and which falls flat. By tracking performance from the first impression to engagement, you can connect top-of-funnel activities to downstream actions like documentation visits or API key creation.
Transparent data is essential for building effective attribution models. Instead of relying solely on last-click attribution or guessing at dark funnel influence, you gain clear insights into how developers first encounter your brand. When combined with self-reported data and proxy metrics, this approach creates a fuller picture of your marketing impact - capturing both measurable touchpoints and the invisible influence happening in private channels.
How to Report Developer Marketing ROI to Leadership
Once you've gathered your metrics and built detailed dashboards, the next step is to present this data in a way that resonates with leadership. The key is to connect developer-focused metrics with broader business outcomes. While GitHub stars or documentation page views might excite your team, executives are more interested in metrics like qualified signups, pipeline value, and revenue. Your role is to bridge this gap and show how developer engagement drives business growth.
Translating Developer Metrics into Business Language
Start by distinguishing between leading metrics (early indicators like YouTube watch time, social engagement, and documentation visits) and lagging metrics (outcomes like qualified signups, demo requests, and ARR). While leading metrics help optimize daily performance, lagging metrics are what leadership uses to assess overall success.
To make the connection clear, assign a dollar value to early-stage conversions. Here's a simple formula: multiply your signup-to-paid conversion rate by your average ARR, then multiply that by the average customer lifetime in years. For instance, if 10% of signups convert to paying customers, your ARR is $12,000, and customers stay for three years, each signup equals $3,600 in value. This calculation gives leadership a tangible way to evaluate your impact.
Another critical number to highlight is Net Dollar Retention (NDR), which measures revenue growth from existing customers through expanded usage. For developer tools, NDR often ranges between 110% and 130% . This metric shows that your marketing efforts not only attract new users but also contribute to revenue growth from existing ones.
Once you've translated these metrics into financial terms, the next step is structuring reports tailored to your audience.
Creating Reports for Executive Audiences
Your reports should vary based on the audience and frequency. For example:
- Weekly updates: Share signup trends, channel performance, and ongoing experiments with your marketing team.
- Monthly reports: Present full-funnel metrics, content performance, and budget comparisons to marketing leadership.
- Quarterly reports: Focus on program-level ROI, pipeline evaluations with sales, and strategic adjustments for the C-suite and board.
When reporting ROI, focus on the program level instead of individual activities. Think of marketing programs as products and measure their overall ROI. As Jakub Czakon, CMO at Markepear, explains:
"You treat it as a product and measure ROI at a program level. You optimize activities within the programs but don't report ROI on them."
If you're asked about the ROI of specific content, explain that these individual activities contribute to larger, value-driven programs .
To ensure your reports are comprehensive, combine software attribution with self-reported data. Conduct quarterly journey walkthroughs with your sales team to review every marketing touchpoint alongside sales engagements. This process not only highlights marketing's contribution but also helps address attribution challenges .
Framing ROI for the C-Suite
When presenting to the C-suite, focus on metrics that demonstrate efficiency and financial impact. Key metrics include:
- Customer Acquisition Cost (CAC) and CAC payback period: These show the cost of growth and how quickly that investment is recovered.
- Lifetime Value (LTV) and CAC:LTV ratio: These highlight long-term profitability and expansion potential.
Use conservative ROI estimates to showcase measurable results while being transparent about attribution limitations .
Additionally, emphasize Product Qualified Leads (PQLs). These leads convert at rates of 15–30%, compared to the 2–5% seen with traditional Marketing Qualified Leads (MQLs) . Highlighting PQL performance demonstrates that your efforts are attracting developers who are genuinely ready to engage with your product.
Finally, include Time to First Value (TTFV) as a velocity metric. This measures how quickly a developer reaches their "Hello World" moment. Reducing TTFV can improve conversion rates and lower churn . By showing how your marketing and documentation efforts streamline this process, you underline their direct impact on the bottom line.
| Metric Category | Key Metrics for C-Suite | Why It Matters to Leadership |
|---|---|---|
| Acquisition | Qualified Signups, PQLs, Demo Requests | Predicts future revenue and pipeline health |
| Efficiency | CAC, CAC Payback Period | Demonstrates growth costs and recovery speed |
| Financial Impact | NDR, LTV, CAC:LTV Ratio | Highlights long-term profitability and growth potential |
| Velocity | Time to First Value (TTFV), Activation Rate | Reflects onboarding efficiency and product-market fit |
Developer Marketing Benchmarks by Company Stage
Defining clear benchmarks based on your company's growth stage can help shape a focused developer marketing strategy. Using a metrics framework, these benchmarks outline what success looks like at different phases of development.
Benchmarks for Early-Stage Companies
In the early stages, the goal is to ensure developers can effectively engage with your product. Key metrics to track include:
- Monthly Active Developers (MAD): Aim for 10–25% monthly growth.
- Activation Rate: Target 20–40%.
- Time to "Hello World": Developers should reach this milestone in under 30 minutes (ideally under 15 minutes).
- Trial-to-Paid Conversion Rate: Strive for 2–5% as you refine your value proposition.
- LTV:CAC Ratio: Keep this between 1:1 and 2:1, reflecting the investment-heavy nature of early-stage growth.
Benchmarks for Growth-Stage Companies
As your company scales, the focus shifts to improving efficiency in converting users and retaining them. Here’s what to aim for:
- Trial-to-Paid Conversion Rates: Increase to 15–25%. For example, Datadog achieved a 22% Product Qualified Lead (PQL)-to-paid conversion rate by identifying PQLs as users who send at least 100 monitoring events and stay active for more than 7 days.
- Net Dollar Retention (NDR): Target 110–130%, signaling strong product stickiness.
- Activation Rate: Maintain a steady 20–40%.
- MAD Growth: Expect a more modest 5–15% monthly growth.
- LTV:CAC Ratio: Improve to 3:1–5:1, showing sustainable acquisition.
- Time to First Value: Reduce this to 15–30 minutes to minimize friction during onboarding.
Benchmarks for Enterprise Companies
For mature businesses, the focus shifts to achieving scalable efficiency and maximizing value. Metrics to aim for include:
- LTV:CAC Ratio: Exceed 5:1, with best-in-class companies reaching 8:1.
- Customer Acquisition Cost (CAC): Expect costs between $2,000 and $8,000 due to longer sales cycles and multiple stakeholders.
- Net Dollar Retention (NDR): Target 130–150%+ to reflect strong loyalty and product usage.
- Trial-to-Paid Conversion Rates: Aim for 25%+ through optimized onboarding.
- Activation Rate: Exceed 40%.
- Time to First Value: Reduce this to under 15 minutes to meet the demands of enterprise developers. CAC payback periods typically range from 8–18 months, with evaluation periods lasting 30–90 days.
| Company Stage | Activation Rate | Trial-to-Paid Conversion | Net Dollar Retention (NDR) | LTV:CAC Ratio | Time to First Value |
|---|---|---|---|---|---|
| Early-Stage | 20–40% | 2–5% | <100% | 1:1 – 2:1 | <30 minutes |
| Growth-Stage | 20–40% | 15–25% | 110–130% | 3:1 – 5:1 | 15–30 minutes |
| Enterprise | 40%+ | 25%+ | 130–150%+ | 5:1 – 8:1 | <15 minutes |
These benchmarks are based on industry data .
Conclusion
Measuring the ROI of developer marketing is all about making smarter, revenue-focused decisions. By tracking program-level metrics and connecting developer engagement to tangible business outcomes, marketing can shift from being seen as a cost center to becoming a true growth driver. This approach not only strengthens your position during budget negotiations but also ensures that investments are directed toward programs that deliver measurable results . It's about bridging your daily marketing efforts with broader strategic business goals.
Your data can pinpoint where developers drop off, highlight which programs should be scaled up or scaled back, and even uncover opportunities for growth. For example, reducing Time-to-Value by 30% has been shown to increase free-to-paid conversion rates from 5% to 7%, driving a 40% revenue increase - all without additional spending .
"If you can't draw a line from your work to business outcomes, you don't have a function - you have a hobby." - Built for Devs
Despite these possibilities, most tech companies still face challenges in effectively measuring the success of their developer go-to-market strategies. The frameworks, dashboards, and attribution methods outlined earlier provide a clear path forward. Use lagging metrics for leadership reporting, self-reported attribution to capture hard-to-track influences like dark social, and treat your marketing programs like products with measurable ROI . These practices can help you create board-ready reports that guide strategic investments.
The aim isn't flawless measurement - it's actionable insights. Focus on metrics that directly inform decisions and tie developer engagement to business growth. Regular, data-driven adjustments will not only demonstrate your impact but also refine your developer marketing strategy over time. By adopting these methods, you can build accountability and earn the strategic support needed from leadership.
FAQs
What’s the best North Star metric for developer marketing ROI?
When it comes to measuring the return on investment (ROI) for developer marketing, developer engagement stands out as the most reliable North Star metric. Why? Because it directly reflects the success of your efforts in fostering technical adoption and growing your developer community.
Key indicators like community participation, API usage, and documentation views offer valuable insights. These metrics not only show how well your developer-focused initiatives are performing but also connect directly to broader business objectives, including revenue growth. By tracking these, you can clearly see how your strategies are driving meaningful results.
How do I define a PQL for my developer product?
For a developer-focused product, a Product Qualified Lead (PQL) is identified through specific engagement metrics. These include actions like SDK implementation, activating key features, completing the onboarding process, frequent API calls, and viewing documentation. These behaviors highlight developers who are actively using the product and are more likely to transition into paying customers.
How can I report dark-funnel impact to leadership?
To demonstrate the impact of the dark funnel, blend self-reported attribution - where you ask developers during onboarding how they found your product - with proxy metrics such as documentation traffic, API key generation, or GitHub stars. These metrics capture engagement and advocacy that often slip through traditional tracking methods. Translate these insights into business language, emphasizing how they contribute to growth and product adoption, even when direct attribution isn't obvious.


